
III. Problems CRR Would Help Fix
As we discussed at length in Our Current Approach Is Doomed to Fail, CR Rankings would give businesses the motivation to improve—to better treat their Workers, the Environment, and the Communities in which they operate. That motivation would then spark major societal change.
In short, with CR Rankings our companies would be motivated to help fix a host of massive problems that currently seem impossible to solve, the Global Commons Motivation (GCM) problems that bedevil us. We have here included a sample of many such problems to get a sense of how CRR can make the world a much better place.
Income Inequality
The Problem
: The gap between the rich and the poor has consistently grown, for the last few decades here in the US and for the last two centuries across the globe. Excessive inequality makes it quite hard for low and middle-income workers to get by. It also weakens and slows down the economy as a whole, thereby making life all the harder for the bottom half. 16x9.jpg)
Alan De Smet/Wikimedia Commons
Income inequality refers to how unevenly pay is distributed among workers. The more that pay gets skewed toward the wealthier few, the higher the inequality. For quite some time now inequality has been on the rise—that is, the rich have gotten much richer while everyone else, well, hasn’t. Back in the 1960’s the average CEO made about 24 times as much as the average worker.1 Now the average CEO makes over 200 times as much.2 But really such disparities have been growing for much longer. The World Bank estimates that global inequality has continually crept higher and higher since 1820 (i.e., since around when modern capitalism was born).3 In other words, despite the many obvious benefits of free market economies, they have always steadily widened the gap between the rich and the poor. And by now this inequality has reached absurd levels. The eight richest people now own the same amount of wealth as the poorer half of all human beings combined.4
Of course, the point here isn’t to criticize rich people for being rich. It is, instead, to note that high inequality does a lot of harm. On the most basic level, high inequality makes it all the tougher for the lower and middle classes to get by, to afford food, rent, health care, and education for their kids. Nearly half of the world lives on less than $2.50 a day.5 About one person in nine worldwide doesn’t have enough to eat.6 Such poverty is heartbreaking, and while its causes are complex, income inequality easily tops the list.
Even here in the United States—by many measures the richest country in the world—decades of rising inequality have made it incredibly hard for large portions of the population to get by. In 2016, a Federal Reserve study found that, if confronted with a surprise $400 bill—for an injury, car accident, etc—47% of Americans say either that they could only pay it off by borrowing money or selling something, or that they could not afford to pay it off whatsoever.7 Almost half of all Americans are that close to being broke. Meanwhile, 83% of Americans currently say they cannot afford college (a.k.a. the ticket to most good, well-paying jobs in the 21st century).8 And then there are those living on minimum wage. According to a 2016 analysis of housing prices, someone working full-time at the federal minimum wage can effectively afford to pay a family’s rent in zero out of fifty US states.9 High income inequality is making life tough for people everywhere.
Inequality doesn’t just create problems because it leads to more poverty, though. As UNC professor of psychology Keith Payne recently detailed in his book Broken Ladder: How Inequality Affects the Way We Think, Live, and Die, the sheer divide in society itself wrought by inequality creates all kinds of psychological problems for those towards the bottom of that divide. Research shows that places with higher inequality have (on average) lower rates of reported happiness,10 higher rates of drug abuse and alcoholism,11 a lower life expectancy,12 and even higher rates of implicit bias13 (i.e., perhaps the biggest reason that African-Americans get fewer job callbacks and get shot more often by the police). In fact, the negative effects of inequality are so deep and pervasive that they can be rather surprising. Recent studies, for example, show a strikingly high correlation between income inequality and political polarization.14 In other words, to fix the perpetual dysfunction of our governments, the data seem to say that, instead of ridding politics of money or preaching about reaching across the aisle, we’d be better served finding ways to decrease income inequality.
There is the persistent idea, of course, that we should be thankful if inequality leads to mega-rich corporate titans. They’re the ones who make the jobs. The richer they are the more jobs they can afford to make and the stronger the economy, right? Numerous studies show that isn’t the case, though. High inequality consistently hurts the economy, decreasing GDP and slowing down growth.15,16 Research also shows that high inequality leads to a higher likelihood of financial crises. In other words, inequality was likely a major cause of the economic crashes that gave us the Great Depression and the Great Recession.17 All told, rising income inequality hurts the lower and middle-classes and slows down the economy. (Translation: it’s bad for pretty much anyone who isn’t in the market for a yacht.)
Meanwhile, the deeper problem is that while inequality continues to rise, our efforts to stop it are falling flat. For all its amazing benefits, capitalism will by default always widen the gap between the rich and the poor. If we want to strike a better balance with the world’s distribution of wealth, we need to find a way to keep all of the vital good of capitalism while creating a better opposing force to drive inequality back down.
How CRR Would Help
: Because 80% of the Workers ranking comes from how fairly a company pays its employees, CR Rankings would strongly push companies to reduce inequality.Most of the Workers ranking (80%) stems from how well a business pays its employees. The Distribution of Wealth metric would rank all corporations by their GINI coefficient, that is by how evenly their pay is spread out. The more even the pay distribution, the higher the ranking. The more top heavy—with low salaries at the bottom and million-dollar bonuses at the top—the lower the CR Ranking. Meanwhile, the Pay Relative to Local Standard of Living metric would rank businesses by how much their employees are paid compared to how much it costs to live where they work. So if everyone’s paid well enough to easily afford rent, health care, and all other basic needs, then the company should score well. The more employees have to struggle just to pay the bills, the lower the ranking. Put those two metrics together and companies would now have a very strong motivation to pay all of their workers enough to make a good living. This would be a game changer, a huge boon to the lower and middle classes. Thanks to CR Rankings, capitalism would for the first time start pushing the corporate world to reduce inequality, not increase it (as it naturally does now).
Global Warming
The Problem
: Human activity is driving a major increase in average global temperatures. It is destroying the world’s ecosystems and costing us trillions of dollars, and the problem still stands to get much, much worse. On top of that, nothing we’re doing to stop global warming is coming anywhere close to working.Global warming (a.k.a. climate change) refers to the gradual warming of the planet’s atmosphere over the past two centuries. While Earth’s average air temperature has always fluctuated, this recent shift has been mostly if not entirely manmade, largely thanks to burning oil, coal, and other “fossil fuels.” These carbon-based fuels have, over many millions of years, stored up most of the atmosphere’s carbon in the ground. When we burn fossil fuels we suddenly spew that CO2 back into the air all at once, and because CO2 traps in heat from the sun more efficiently than the other gases in the atmosphere, we thus dramatically heat up the planet’s atmosphere. Since 1880, the average global air temperature has increased by 0.85 degrees Celsius,18 and Earth keeps setting record temperatures each year. 2014 was the hottest year ever recorded on Earth…until 2015 broke that record…and then 2016 broke that record…
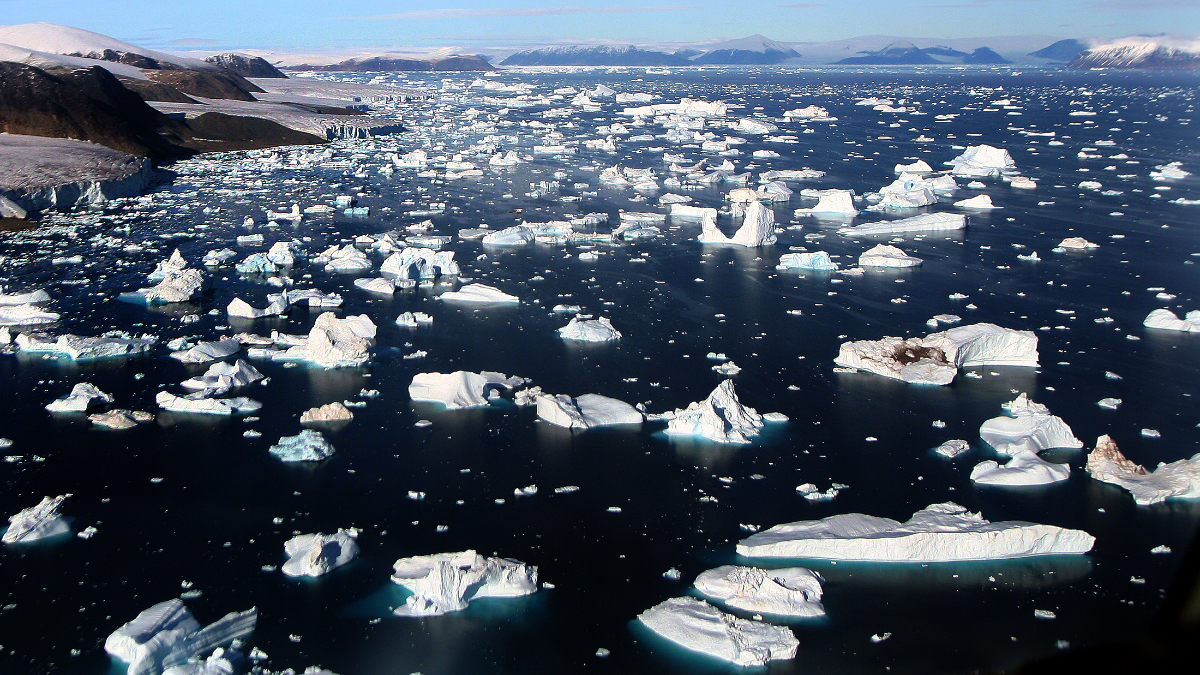
Brocken Inaglory/Wikipedia
This might all sound like small potatoes, though. Who cares about slightly warmer temperatures? The problem is that while daily temperatures can jump up and down and everything will be fine, changing the average global temperature is actually a really big deal. It melts glaciers and raises sea levels. It brings more droughts, more floods, and more hurricanes. It destroys all kinds of habitats, wipes out crops, and kills off scores of species. It acidifies our oceans, destroying our coral reefs and decimating the world’s phytoplankton population, which in itself speeds up global warming by taking out the biggest consumers of CO2 we have. Experts estimate that global warming costs us around $2 to 11 trillion each year,19-22 a figure that’s only poised to balloon over time. At best, global warming is an extremely expensive nuisance that will greatly harm our economies. At worst, it could quite literally do our species in.
But all of that being said, we haven’t even gotten to the real problem with global warming. The real problem is that nothing we’re currently doing to stop global warming is working. For decades now we have installed more efficient dishwashers and lightbulbs at home. We have cheered as solar and wind power technologies have made huge strides. Meanwhile the vast majority of the world’s nations have met every year at United Nations conferences and signed global treaties all promising to reduce their carbon emissions. And what has happened during that time? Exactly what was already happening. Carbon emissions have continued to skyrocket. Since those UN conferences began in 1995, global CO2 production is up over 53%.23
Global warming is a runway train. It is already arguably the defining problem of this century. If we don’t find a way to legitimately stop it soon, it will become the defining problem of humanity throughout all time.
How CRR Would Help
: 40% of every company’s Environment ranking would come from its carbon footprint. CRR would thus give the strongest financial incentive ever given to businesses—who are the biggest producers of greenhouse gases—to reduce those gases and turn global warming around. To give even more motivation to improve, CRR would reward any company that develops new technologies that reduce carbon emissions outside of the company, too.As 40% of the Environment ranking, the Carbon Footprint metric ties for the largest impact of any of the metrics on a company’s CR Ranking. This metric would include all the major ways a business could warm the planet—electricity used, fuel burned, forests cut down, livestock kept, etc. To get a higher ranking with the Carbon Footprint metric, a business would therefore be motivated to improve across the board. That could mean more fuel-efficient vehicles, better office insulation, on-site solar panels, you name it. With such a huge rankings influence, the Carbon Footprint metric could very likely set off a war in the business world to see who could lower their carbon footprint the most.
Just as climate change would have an outsized importance over other societal problems, it would also create the highest innovation point bounties. With CRR, any corporation could earn innovation points—points that would then raise its rankings through the Additional Factors metric—for new discoveries that help the world but that don’t earn that company any profit. So if a business created a promising new carbon capturing device that it had no plans to use itself for financial gain, it could get innovation points that would boost its Environment ranking. The same would go for, say, creating a new electric engine with twice the efficiency, so long as that technology goes on to be used by millions of vehicles produced and used by other businesses. Such innovations normally would not influence a company’s CR Rankings, so by awarding them innovation points we ensure that that company would still be motivated to shoot for such beneficial discoveries. As far as the number of points given, innovation points would be given in greater and smaller numbers based on the need for those innovations. Since climate change is about as important a need as possible, some of the highest bounties would be given to new emissions-reducing technologies.
With the Carbon Footprint metric and innovation points, CRR would fundamentally change the market with respect to global warming. Instead of the current competition to be as cheap (and therefore carbon-dirty) as possible, CR Rankings would turn companies around. For the first time ever, the market would continuously push corporations to lower their greenhouse gas emissions until there would be no carbon footprint left.
Water Scarcity
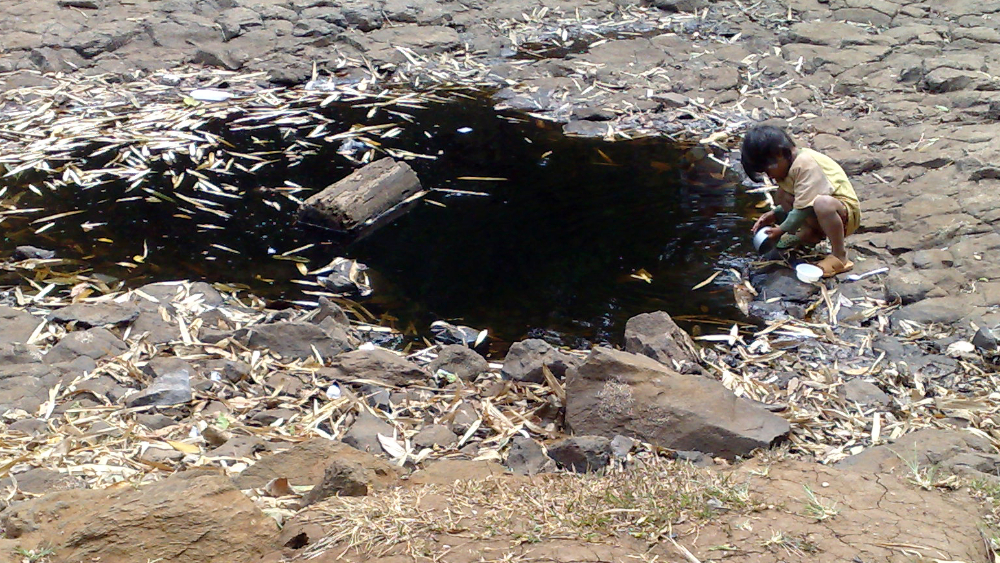
The Problem
: Because we use more freshwater than we get back in precipitation, our stores of water are steadily drying up around the globe. With less water for crops, food prices soar. And with less clean water to drink, diseases spread that kill millions.When we use water at home or on the farm, that water comes from rivers, lakes, and aquifers (i.e., vast underground pools of water that store the rainwater that seeps down from above). While the amount of rain and snow that replenishes these sources remains about constant each year, the amount that we use each year continues to go up. Increasingly around the globe we are thus now using more water than we get back in precipitation. That isn’t favorable math. It means our rivers, lakes, and aquifers are drying out, and the more people on Earth the worse it’s going to get. Almost one-fifth of the world’s population currently lives in areas suffering from water scarcity. By 2030 the UN estimates that it will be one half.24
Here in the US that means water rationing in an agriculture-heavy California, as well as a Colorado River so over-tapped that none of its water has naturally made it to the Gulf of Mexico since 1998.25 Perhaps the biggest water shortage in the US, however, is one you’ve probably never heard of: the Ogallala aquifer. Stretching across eight states, the Ogallala irrigates farms all across Middle America. Thanks to overuse, though, its water level is dropping fast, by as much as two feet per year in parts of Kansas.26 Food production is therefore likely to peak in parts of the Midwest within a few decades,27 which means higher food prices for everyone in the country.

The Euphrates River snakes through the now desertous Iraq, the once-fertile region where human agriculture likely first began.
NASA/Unsplash
In other parts of the world, water scarcity is already much worse. Because of the lack of clean freshwater in much of Africa and southern Asia, people there don’t just have a hard time irrigating their crops. They are regularly forced to drink fecally contaminated water. As a result, they regularly contract diseases like cholera, typhoid fever, and diarrhea. 3.4 million people—mostly children—die every year from such water-related diseases,28 making them one of the leading causes of death worldwide.
At best, water scarcity means we all lose a lot of money from higher food prices and expensive infrastructure projects. At worst, it means struggling to survive or even death. Even if we were to solve global warming tomorrow, water scarcity is the looming environmental disaster on the horizon. As our population continues to grow exponentially, we will drain our water stores faster and faster. Water scarcity stands to be one of the biggest challenges humanity will face in the 21st century.
How CRR Would Help
: Most of the world’s freshwater is used by agriculture and industry, and with the Water Use metric CR Rankings would push those sectors to become much more water efficient.It’s definitely helpful that we citizens try to cut back our water use with quicker showers, low-flow toilets, and less lawn watering. However, we are inherently limited in how much we can accomplish at home. Agriculture and industry account for about 88% of the world’s water consumption29—that is, they use the lion’s share. If we really want to make a serious dent in water scarcity, we should focus less on our home toilets and more on our farms and factories.
CR Rankings would do just that. The Water Use metric would rank all companies by how much water they use and count for 15% of a business’s Environment ranking. Any business that uses a lot of water would thus have a strong motivation to start using less and less of it. Given that an estimated 60% of the water used in farming gets wasted,30 there should be a quite a good amount of room for improvement. There’s also a lot of improvement to be made by switching to more water-efficient products. Coffee, for example, takes about four times as much water to make as tea does. Making a pound of beef requires about a hundred times as much water as making a pound of tomatoes.31 With CR Rankings, that environmental impact would start to show in products and naturally start to move us towards using more water-efficient products.
All told, CRR would over time push our farms and factories to use much less water. And that’s a great thing. It would save us plenty of money and could also save many thousands of lives.
Corporate Tax Avoidance
The Problem
: In recent years, companies have increasingly moved their money around the globe to avoid paying billions in taxes. Such tax avoidance is unfair to the companies that play by the rules, and it inevitably leads to some combination of bigger budget deficits, cuts in government services, and a bigger tax bill for the rest of us.The details can be rather tricky, but basically this kind of tax avoidance works by operating the actual business in one place while stashing the money somewhere else. So even if your retail store chain doesn’t extend beyond the borders of Ohio, an affiliated company handles all of your money in Ireland. Why Ireland? Because the corporate tax rate there is just 12.5%, almost two-thirds less than what it is in the US. This just-barely-legal tax avoidance is especially prevalent in the US, where it costs an estimated $100 billion in lost tax dollars every year.32 Combine this shifting of money with other tax breaks and loopholes and many corporations don’t really pay taxes at all anymore. A 2014 study by Citizens for Tax Justice reported that, of the 288 Fortune 500 companies that have each been consistently profitable from 2008 to 2012, 39% of them paid zero federal income taxes at least one year in that span.33
The problem here is pretty simple. Those taxes are supposed to fund the government, that is, to fund public schools, police stations, road construction, the military, health care for the elderly, etc. If our companies don’t pay their share of the bill, then some mix of the following three things must happen: a.) we citizens have to pay more in taxes b.) the federal deficit grows and c.) government services get cut. And by forcing cuts in government services and creating higher tax bills for the lower classes, corporate tax avoidance also helps increase economic inequality.

The Panama News
Some might wonder, though, why businesses pay taxes at all. Shouldn’t it just be citizens who pay taxes? After all, the way things are a business owner pays taxes twice, as a business and as a citizen. Isn’t that unfair? An important thing to remember when it comes to corporate taxes, though, is that businesses quite legitimately owe them in return for the government services they use. Companies need roads for driving on; airports and seaports for transferring shipments; power lines to supply electricity to their offices; sewage systems to remove their waste; public schools to educate the children who later become their employees; government-subsidized health care to keep its poorer employees healthy; and the police, military, prisons, and court system to ensure that the communities in which they work are safe for business. All of that costs a lot of money. Businesses all benefit immensely from these services, but many are now skipping out on the tab.
Others defend tax avoidance not because it’s morally defensible, but because businesses simply have to. If such tax loopholes exist, then someone is going to take advantage of them. All other businesses then face a choice: avoid taxes too or, by nobly paying their taxes, put themselves at a disadvantage against their competitors, competitors who now have extra millions or even billions of dollars to go towards beating them with lower prices, better advertising, and/or flashier products. It’s that simple.
The troubling part of this defense…is that it’s right. And here’s where things really get bad. If corporations have backward incentives with paying taxes, governments have just as bad incentives in making them pay. Fighting to raise corporate tax rates and close loopholes may scare away businesses (and their jobs) to some other country with a lower tax rate. So few politicians have the appetite to do so (lest they be voted out of office when the local economy tanks). As a result, what we’ve actually been seeing is governments doing the opposite, steadily lowering their corporate tax rates. From 2003 to 2015, the global average corporate tax rate (weighted by GDP) steadily decreased from 35.5% to 29.8%.34 Instead of trying to stop corporate tax avoiders, governments are cowering before them and begging them not to leave altogether, if only because they know fighting would likely be a losing game. Without some better way to make companies pay the taxes they owe, corporate tax avoidance stands not just to continue, but to steadily grow.
How CRR Would Help
: 40% of the Community ranking would stem from how well a company pays its fair share of taxes, giving all companies a strong financial incentive to stop the tax avoidance game.The Shouldering the Tax Burden metric ranks businesses by how much they pay in taxes relative to the corporate tax rate where a.) they do business and b.) where they sell their products. In other words, companies are judged by how much they’re paying compared with how much they should be paying. The higher the resulting ratio comes out, the higher the Community CR Ranking. Corporate Responsibility Rankings would thus motivate businesses to go beyond just doing what’s barely legal and instead fully pay the taxes they truly owe.
Note that using CRR to push corporations to pay more in taxes would, as with the rest of the issues CR Rankings combat, align their financial interest with the interest of the community at large. Shaming such companies (a current favorite approach of many politicians) is accomplishing nothing. Neither is trying to raise corporate tax rates and/or closing loopholes getting anywhere. These efforts fail because they don’t fix the underlying perverse incentives of businesses to do the bad thing that is to avoid taxes. CRR would address that underlying motivation, and that’s why it would work.
Workplace Harassment and Assault
The Problem
: Workplace violence and harassment are all too common, sexual and otherwise.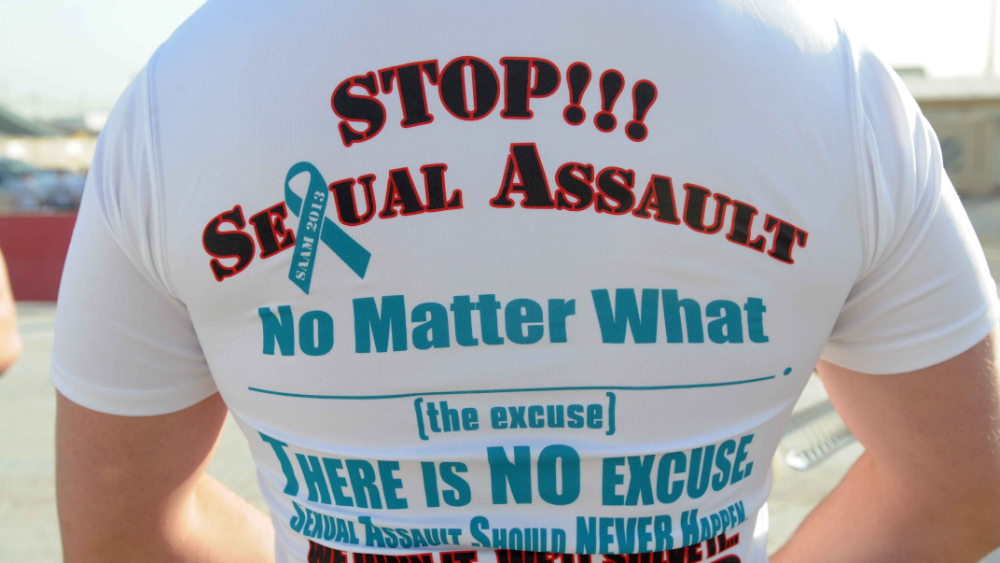
Ashley Bell/DoDLive
If the #MeToo movement has shown us anything, it’s that sexual harassment and assault are shockingly widespread in the workplace. One in three women, for example, reports having been sexually harassed at work35 (although some estimates put that percentage much higher).36 And while #MeToo has made great strides outing many sexual predators, the almost certain reality is that the vast majority of sexual misconduct cases involve people who aren’t famous enough to make big news headlines—those in textile factories, fast food restaurants, farms, mid-level office work, etc. And without big headlines to out these offenders, it’s pretty likely that they will keep right on harassing and assaulting. Meanwhile, the only other main recourse for most victims is to report their abuse to their boss or to the police…but that could easily backfire. 75% of harassment victims say they experienced retaliation after reporting their experiences.37 It therefore shouldn’t be any wonder that most victims don’t report such abuse at all.38
Of course, workplace violence extends far beyond sexual acts. Almost one fifth of all violent crimes in the US—including crimes like robbery and aggravated assault—take place while that victim is on the job.39 That amounts to almost two million violent workplace crimes reported every year.40 Some of this no doubt stems from inherently violent jobs (police officers experience the highest rates of violent crimes, for example). Many if not most workplace crimes should be preventable, though, especially more common acts like sexual harassment. All employees should be able to feel safe at work, and yet a staggeringly high number of them don’t, even here in arguably one of the safest countries in the world.
How CRR Would Help
: By ranking businesses by how well they prevent harassment and assault, CR Rankings would motivate businesses to take much more serious steps to eliminate them from the workplace.CR Rankings would fight harassment and assault in the workplace in many ways. First, half of the Worker Safety & Health metric would rank companies by how many work-related injuries, illnesses, and deaths they incur per 100 employees each year. Each incidence would be weighted by severity (e.g., a work-related death would count much more than a work-related broken finger). Assault and harassment wouldn’t just count in this list—they would be weighted quite heavily. If an employee or two are harassed at one office, much less sexually assaulted, then that company’s rankings would be hit hard. All such incidents reported to the police or to the company itself would count towards this tally.
Beyond the sheer tally of such incidents, it also matters how safe the employees of a company feel to never be harassed or assaulted in the first place (much less a second time). This feeling of safety would thus factor into the second half of the Worker Safety & Health metric. As part of this metric, all US employees would be asked several questions about their companies. One would have employees rate how well they feel their employers prevent and punish harassment and assault. With this Safety & Health question built into CR Rankings, corporations would thus have all the more incentive to crack down on a workplace culture that leads to assault and harassment, as well as the acts themselves.
Of course, all of this wouldn’t amount to a hill of beans if employees were still intimidated into silence. A boss who’s harassing a subordinate, for example, would have a particularly high motivation to threaten to fire them if they report anything. To discourage such manipulation, the CR Bureau would use the Additional Factors metric to heavily dock the rankings of any company that tries to distort their CR Rankings. Any employee that feels she has been threatened against or punished for reporting such incidents could directly report this to the CRB. Her company would receive lower CR Rankings and then think twice next time before trying to block the truth or punish victims.
All together, CR Rankings should greatly reduce assault, harassment, and other workplace violence. CRR should furthermore reduce the ever-present fear of such behaviors that women especially have to live with all the time. It should also make women feel more empowered to simply do their jobs and earn promotions based on merit, not based on any sexual favors for the boss.
Food Waste
The Problem
: About a third of all food produced in the world gets thrown away, all while one in nine people regularly goes hungry. This awful reality unfolds in large part because it’s cheaper for businesses to throw away excess food than to donate it.According to the Food and Agriculture Organization of the United Nations, 32% of the food produced worldwide in 2009 was either lost or wasted.41 In the United States, that figure is as high as 40%.42 The tragedy is that, simultaneously, many people go hungry. There are an estimated 42 million “food insecure” people here in the US43 (i.e., those who don’t reliably get enough affordable, nutritious food) and almost 800 million hungry worldwide.44 We should already be growing enough food for everyone. Where is the disconnect? Why do we let so many become malnourished or even die of hunger?
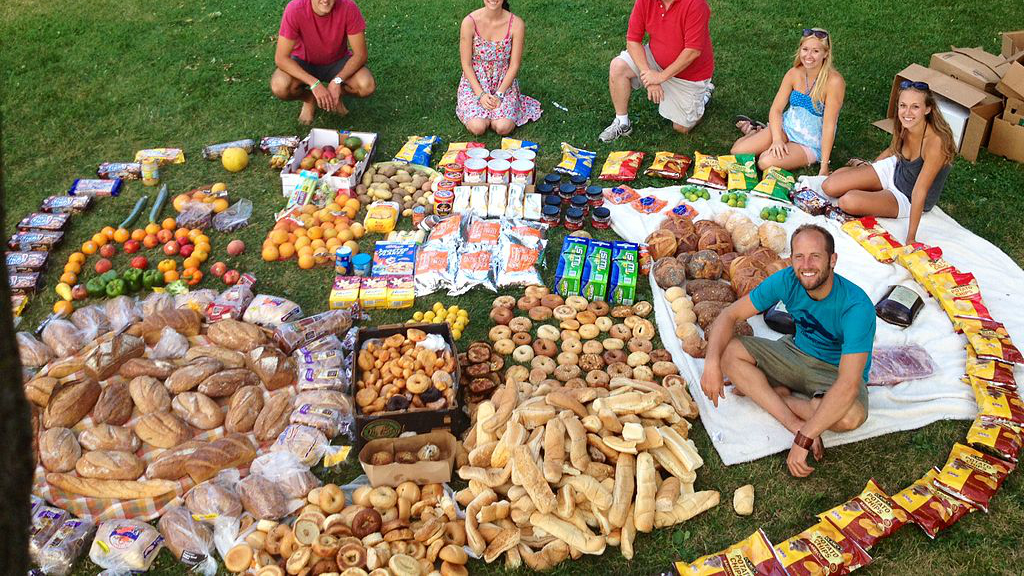
Food waste activist Rob Greenfield demonstrates the food he and friend Dane Gottschall found in two days of dumpster diving in Madison, WI.
Sean Aranda/Food Waste Fiasco
Quite a bit of the blame rests on us the consumers. We aren’t careful enough to eat everything we buy and are also unnecessarily paranoid about expiration dates (thus tossing plenty of still good food).
However, a large portion of the food we waste falls off somewhere along the production line—unharvested at the farm or thrown out at the grocery store or restaurant. The reasons why vary. First, here in the US the USDA has arguably pretty strict grading standards for the foods that make it to the grocery store, standards that are based almost entirely on the appearance of the food, not the safety of eating it. Those standards make much of the safely edible food a farm produces unprofitable to sell. Go to any orchard and you’ll see a blanket of perfectly fine fruit on the ground because each piece of fruit was deemed too aesthetically imperfect to garner a No. 1 USDA grade.45 The grocery store, meanwhile, overstocks items like produce to make them look more appealing—who wants to buy an apple when it’s the last one lying there? Restaurants overstock, too, to make sure they don’t run out of any dish each night. Both then usually end up tossing the extras.
The question then, of course, is why not donate all of that extra food to food banks? Some stores and restaurants do, but plenty don’t. In an interview with PBS News Hour, Harold McClarty, owner of HMC Foods, perfectly explained why most businesses don’t donate. “Getting it into the hands of somebody to eat it isn’t free. There’s got to be an economic incentive to move more of this into…the food banks. … It’s a lot easier and cheaper to just—basically throw it away.”46 Thus, food companies don’t donate much. Until farms, grocery stores, and restaurants have a bigger economic incentive to donate that food, they won’t. And in the meantime many millions of people will continue to unnecessarily go hungry.
How CRR Would Help
: By giving food businesses a financial incentive to donate their excess food, CRR would simultaneously reduce food waste and hunger.Currently there are some state and federal tax breaks to encourage corporations to donate surplus or “damaged” foods. However, there clearly isn’t enough of a financial motivation to donate food. If there were, we wouldn’t waste a third of what we produce and food banks would be bursting at the seams with donations.
With the Charitable Giving metric, CR Rankings would rank all businesses by how much of their income they give away to charity. In addition to money, though, goods and services would count, too. So the more excess food a farm, restaurant, or grocery store donates, the higher its Community ranking would rise. That would give businesses the financial incentive to finally start donating food instead of just throwing it away. Thus with CR Rankings, we should see food waste drop quite a bit, along with the number of people going hungry.
Rainforest Destruction
The Problem
: We are cutting down the world’s rainforests so quickly that they are on pace to completely vanish within a century.47 Destroying rainforests eliminates a major source of pharmaceutical drugs, hundreds of thousands of species, one of our best tools in the fight against global warming, and some of the most beautiful places on Earth.
Rainforest Action Network/Flickr
As you likely learned in school at some point, the world’s rainforests are the most richly biodiverse ecosystems on the planet. They’re also being cut down at an extremely rapid rate. While rainforest destruction was a much more talked about problem back in the 1990’s, the problem has actually accelerated since to about 80,000 acres cut down per day,48 largely for space to graze cattle and grow crops. We humans, meanwhile, drive an estimated 50,000 species to extinction every year.49 Because about half of all of Earth’s species live exclusively in rainforests,50 roughly half of those extinctions come from cutting down rainforests. And as the rainforests go, so does a major absorber of the world’s carbon dioxide and one of our best sources of new pharmaceutical drugs. They’re also simply one of the coolest places the world has to offer. Try to tell me that you don’t care that the home of the chimpanzee, gorilla, parrot, toucan, jaguar, anaconda, and poison-dart frog is being methodically destroyed and I’ll question whether you are in fact a real human being.
How CRR Would Help
: Cutting down rainforests (or working with anyone who does) would lower a company’s CR Rankings on multiple metrics. Businesses would thus be strongly encouraged to stop destroying our rainforests and start protecting them instead.With the Carbon Footprint metric, deforestation would lower a company’s CR Environment Rankings. This would motivate corporations to limit if not completely stop their contributions to deforestation. What’s more, as part of the Environment Additional Factors metric, logging in forests designated as rainforests would earn a company extra ranking losses for contributing to irreparable damage to the environment, given the higher warming effect per acre plus the species endangerment and extinction involved. Such ranking reductions would give businesses an added incentive to switch to logging elsewhere or to reduce logging in general and switch to more recycled paper products. They would also motivate locals living in and among rainforests to switch from slash and burn agriculture to more environmentally friendly pursuits like ecotourism. Overall, with CR Rankings the alarmingly fast destruction of our rainforests should slow down quite a bit, if not stop altogether someday.
National Deficit and Debt
The Problem
: Almost every year our government spends more than it takes in in taxes, leading to trillions of dollars of debt. That debt endangers the long-term health of the economy and forces us to spend hundreds of billions just to pay off its interest every year.74 of the last 86 years the US federal government has run a deficit51—that is, the amount of money the government took in with taxes was less than the amount it spent. For 2017, that shortfall will be a projected $693 billion.52 That money has to come from somewhere, of course, so the government borrows it—from other countries, US citizens, companies, and even itself. Each year that we borrow from others, we add to the national debt. As of summer 2017 the total US national debt was closing in on $20 trillion.53
Believe it or not, owing money like this is a fairly standard practice around the world. So long as that debt doesn’t get out of control, many if not most economists argue it’s a reasonable course of action that won’t sink the economy. Sometimes debt can sink economies, however. Greece, Portugal, Italy, and Spain so went bankrupt during the recent financial crisis in Europe.
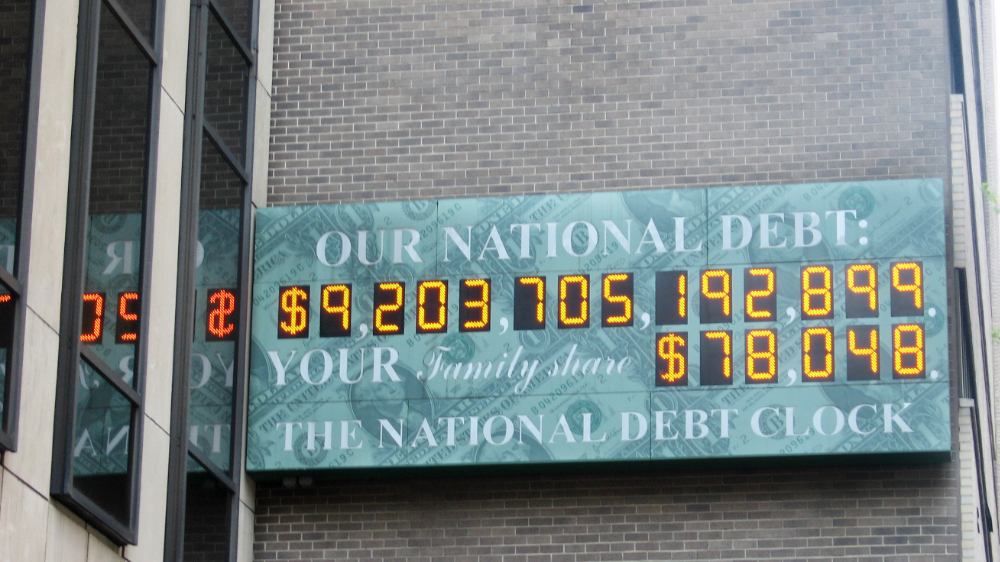
Jesper Rautell Balle
Even without causing an economic crisis, though, relying too much on deficit spending will inevitably create two unavoidable problems. First, your citizens are eventually going to have to pay the money back. Second, just paying the interest on the debt alone can make quite a hefty bill each year. The US paid about $240 billion in interest on the national debt in 2016.54 This yearly interest payment on the debt has grown to over 6% of federal spending each year,55 taking a huge chunk of money that could otherwise be spent on better schools, military research, the space program, tax relief, you name it. Getting the deficit under control and paying back our debt would be a huge boon to cash-strapped taxpayers and to many shortchanged government priorities each year.
However, most politicians have little appetite for deficit reduction. Cutting the deficit almost has to require a.) higher taxes, b.) cuts in government services, or c.) both. That’s quite an unpopular set of options. If you raise taxes, everyone will be mad. If you cut services, everyone will be mad. Politicians also get a lot more credit for what’s happening now than what happens twenty years from now, so why make the unpopular sacrifices needed to ensure better government finances twenty years from now? All that will do is get you voted out of office. It’s therefore no wonder that we run deficits almost every year.
How CRR Would Help
: By fighting corporate tax avoidance and reducing the need for government welfare programs, CR Rankings could cut the federal deficit by hundreds of billions of dollars.CR Rankings would help reduce the federal deficit in two key ways. First, with the Shouldering the Tax Burden metric, companies would be rewarded for paying their fair share of taxes. The more that incentive helps eat away at the gap between what companies should be paying in taxes and what they actually are paying—a roughly $100 billion gap per year in the US56—the more money the government can take in to help reduce the federal deficit. Close that tax evasion gap entirely and you’ve taken a giant bite out of the deficit.
Meanwhile, CRR would perhaps have an even bigger impact on the deficit by lifting up the working poor. The Distribution of Wealth and Pay Relative to Local Standard of Living metrics (representing 80% of the Workers ranking) would push companies quite a bit to increase pay for their lower-level employees. One huge, easily unnoticed benefit with all of this better pay is that it would take away much of the financial burden on the government to care for the poor. In 2014, US state and federal governments spent about $680 billion on the five main welfare programs for the poor: Medicaid, Children’s Health Insurance Program (CHIP), Supplemental Nutrition Assistance Program (a.k.a. food stamps), Earned Income Tax Credit, and Temporary Assistance to Needy Families.57-62 Note that a majority (approximately 56%) of that money goes to working families.63 Thus, raise the pay for those impoverished working families, and the government would not need to spend nearly so much on welfare programs. In this respect alone, CR Rankings could save the government tens if not hundreds of billions of dollars each year.
Combine the welfare program savings and the decrease in corporate tax avoidance, and we should at the very least see the US federal deficit shrink quite a bit. We could possibly even see the deficit completely disappear. Again, keep in mind that the economy and our political climate are incredibly complex, making it rather difficult to predict with much accuracy how much we could realistically see the deficit cut. It’s especially difficult to predict because the moment more money starts to come in, politicians tend to want to spend it. What we can say, though, is that there are enormous, real sums of money—hundreds of billions of dollars each year—that CR Rankings would help push the government to save instead of spend. And that’s just in the US. CRR would really help any country ailing from high deficits, corporate tax avoidance, and expensive welfare programs (for example Canada, Japan, most of Europe, and really most any of the other more affluent nations of the world).
Diseases of Poverty
The Problem
: Many diseases ravage the poor simply because the poor don’t have adequate access to clean water, food, health care, and safe home heating. Many more diseases ravage the poor because developing medical treatments for them is too unprofitable. Thanks to diseases of poverty, millions die each year, while millions more suffer.A disease doesn’t care how much money you have. Given the chance, it will infect anyone all the same. However, money can still make a huge difference in who gets sick and how badly. “Diseases of poverty” disproportionately affect the poor because it’s the poor who don’t have the basic resources needed to fight them. Malaria, for instance, still kills almost a half million people a year,64 largely because the insecticides, mosquito nets, and medicines needed to stop the disease aren’t widely available in poorer tropical countries. Similarly preventable, nearly 95% of those infected with HIV/AIDS live in so-called developing countries65 where the education and contraceptives needed to slow the spread of the virus are lacking.
Dtfman/Wikimedia Commons
Diseases of poverty hit children particularly hard. Half a million children tragically go blind each year simply because malnutrition has led to an easily treatable vitamin A deficiency.66 Diarrhea kills another half million kids worldwide each year, mostly just from a lack of clean drinking water.67 Children are even more devastated by lower respiratory tract infections like pneumonia, the leading cause of death in those under the age of five. Why are so many afflicted? Largely because the poorer half of the world’s population have no better way to cook and heat their homes than by burning biomass (wood, charcoal, coal, manure, food waste), a practice that often means breathing in unsafe levels of smoke in poorly ventilated houses. Breathing in those harmful fumes leads to higher rates of infection, which then leads to another four million prematurely dead per year.68
Getting the idea? Diseases of poverty are devastating, and tragically it isn’t even because the diseases themselves are especially dangerous. It’s only because the poor can’t afford to properly deal with them.
Meanwhile, diseases of poverty also arguably receive a disproportionately small portion of medical research funding. Out of the 1,393 new drugs approved for use between 1975 and 1999, only 13 (less than one percent) were for tropical diseases, i.e., those that affect the relatively poor inhabitants of the tropics in South and Central America, sub-Saharan Africa, and Southern Asia.69 Why wouldn’t pharmaceutical companies want to develop new drugs for diseases of poverty? Well, really the better question is why would they? New drugs and vaccines can cost millions of dollars to research. If ultimately your goal is to make money, why would you put all of that money into a drug that goes to the poor, that is, to people who can’t really pay you back? Why not develop a new cholesterol drug instead and reap in billions from European and American customers? The same logic goes for, say, the kind of cheap, easy-to-use filtration systems that could sanitize water for poor rural villages. If it won’t make someone money to make it, then it’s highly unlikely that it’ll ever be made.
Anyone keeping up with the news in 2014 got to see this tragic financial reality play out live. As an Ebola epidemic spread like wildfire through West Africa, we were all left to collectively wonder why no one had yet developed a vaccine. Ebola is one of the most potently deadly diseases on the planet. It’s also one that we’ve all known exists for decades. Why on Earth would no one have created a vaccine yet? Seen through the lens of a profit motive, though, it totally makes sense. Ebola has almost exclusively affected the relatively poor inhabitants of West and Central African countries. Thus, why put money into developing a vaccine when the poor countries that need it probably won’t be able to pay you enough to cover the costs of the research? Let someone else worry about such noble work. We the pharmaceutical companies need to make a profit to stay in business! Thus, only after many thousands of West Africans died and panic spread globally did the money surface to research a vaccine. (And so we now already have one that is reportedly 100% effective.)70
Now, to be fair, many argue that this funding discrepancy is not so big of a problem, that really we have the drugs needed to combat most diseases of poverty—it’s just more of the poverty itself that we have to fight. The World Health Organization, for example, says that there are only three truly “neglected” diseases that don’t receive nearly enough research funding: African trypanosomiasis, leishmaniasis, and Chagas disease.71 Even if that somewhat rosy characterization is true, though, these three diseases still infect millions and kill tens of thousands each year. Erectile dysfunction kills no one, but that doesn’t stop the wealthy from spending over a billion dollars on medications to combat this quite unserious problem.72 However big the discrepancy, it still exists. As the system currently stands, not nearly enough is money is put towards ending diseases of poverty.
How CRR Would Help
: CR Rankings would go a long way towards reducing the poverty that allows diseases of poverty to thrive. It would also reward companies that develop new vaccines, medicines, and other innovations that help fight these often-neglected diseases.The first thing CR Rankings would do to combat diseases of poverty is to combat poverty itself. 80% of the Workers ranking would stem from how fairly a company pays its workers. That would strongly push businesses to better pay their lower-wage workers, whether here in the US or in China, Bangladesh, the Dominican Republic, wherever. With more money, impoverished workers around the world could better afford basics like food, plumbing, water filters, medicine, airtight chimneys, and cook-stoves. That would all go a long way towards eliminating the diseases of poverty that thrive only from a lack of such basics.
In fact, CR Rankings would be especially helpful in combatting poverty where it is most concentrated. The key would be the Pay Relative to Local Standard of Living metric. Specifically, the PRLSL metric would rank companies by how well their wages compare with the local median cost of living. (So if your employees don’t make enough to comfortably pay for food, rent, and utilities near where they work, then your Workers ranking will be in the trash.) Now, included in that median cost of living calculation would also be access to clean water, indoor plumbing, and basic health care—exactly the kinds of infrastructure that are lacking in many areas of concentrated poverty. Thus, if a business wants to enjoy cheap labor in such an area (by, say, operating a garment factory in Bangladesh) and doesn’t want low CR Rankings, it would need to find a way to make sure its employees then get those basic needs covered. That could mean paying its workers enough that they could afford to build plumbing and pay for medical care on their own. Or it could mean providing proper housing and doctors itself. Or it could mean working with the local government to build that needed infrastructure. With that last option, the business would boost its Workers ranking (by making sure its employees are healthy) and its Community ranking (by putting in charitable work). The company flourishes, the impoverished country booms, and its inhabitants can now more legitimately escape poverty. Win-win-win. And as better access to food, clean drinking water, sanitation systems, and health care abound, diseases of poverty should steadily fade away.
CR Rankings would further help wipe diseases of poverty out with innovation points. As part of the Additional Factors metrics, innovation points would be rewarded to any company that makes any new discoveries that would help the world’s workers, environment, and/or communities. These points would then raise that company’s rankings—the bigger the global impact, the higher the raise. Breakthroughs for diseases of poverty like new vaccines, medicines, and cheap water sanitation devices would garner big time innovation points. With that profit motive dangling before them, pharmaceutical and other medical corporations would actually now have the motivation to go make all of those life-saving new discoveries. Imagine the major global health improvements we could thus make with innovation points. All told, by reducing poverty and incentivizing new medical innovations, CR Rankings would become a major force in eliminating diseases of poverty.
Gender Pay Gap
Seattle Municipal Archives
This gap has shrunk quite a bit over the last fifty years. There’s also disagreement about why this gap persists, exactly—are employers discriminating against women or are women choosing less lucrative professions? However, the simple fact is that a wide gender pay gap still exists, which is definitely an awful state of affairs. Any time one broad demographic group earns significantly less than another, millions suffer and our meritocracy is undermined. (What man could say he is okay with earning 78% of what a peer does because of something that has nothing to do with how good he is at his job?)
Part of the problem now, though, is that we have laws on the books prohibiting wage discrimination against women…but the pay gap persists. The lion’s share of employers throw up their hands, insisting that they don’t discriminate and that it must be someone else. What then?
How CRR Would Help
: By reducing income inequality in general, pushing companies to increase flexibility in employee hours, and tracking gender pay equality in all companies, CRR should do quite a bit to close the gender pay gap.The first, most basic way that CR Rankings would help reduce the gender pay gap is by reducing income inequality overall. When you shrink the pay gap between those at the top and those at the bottom, any groups that are paid less on average should benefit more than others. Hence, because women are on average paid less than men, women stand to gain more from shrinking income inequality.
CRR would also take a more targeted approach to gender inequality, though. According to research by Harvard economist Claudia Goldin, the biggest driver of the gender pay gap is a lack of “temporal flexibility.”74 Temporal flexibility means how flexible a business is with how many hours its employees work and when exactly they put in those hours. Because women tend to get stuck with more family obligations—e.g., child rearing and caring for elderly relatives—they tend to need more of that temporal flexibility. They might still put in the same number of work hours overall, but they need certain times off to pick up kids from school or deliver medication to a sick parent. Most businesses discourage this kind of flexibility, though, especially for higher-power, higher-paying jobs. Thus, to get the flexibility they need, women often end up taking lower-paying positions.
As part of the Worker Safety & Health Questions, CRR would rank corporations by how well they give temporal flexibility, according to their employees. The more flexibility businesses give with when and how long to work, the better the Worker rankings. Companies would also be ranked by how overworked and overstressed their full-time employees rate themselves to be, encouraging companies to relax their emphasis on long workdays. That would mean less-stressed, happier employees across the board, but also a more hospitable work environment for the women who simply can’t stay at work for twelve hours straight. (And by giving men more time off, it might also get men to help more with those family obligations, thereby giving women more freedom to work more, too.)
On top of these features that would automatically factor into each company’s CR Rankings, CRR would also create gender shadow rankings. These rankings would track the gender disparity in pay and raises in every company. The “shadow” rankings part means that they would not automatically factor into a company’s CRR (for fear of creating perverse incentives, as described in greater length in Additional Notes). What they would do is help the CR Bureau more easily identify any businesses engaging in discrimination and then dock their rankings within the Additional Factors metric.
All told, by reducing general income inequality, pushing companies to increase temporal flexibility, and tracking the gender equality in all companies, CRR should help close the gender pay gap.
Racial Pay Gap
The Problem
: Blacks and Hispanics make far less than whites and Asians in America. What’s worse, though, is that this pay gap hasn’t really changed much over the last four decades.
Adam Linker/NC Policy Watch
As of 2015, black and Hispanic men earned 73 and 69 cents for every dollar earned by white men, respectively.75 Unsurprisingly, women of color fare even worse. Black and Hispanic women respectively made 65 and 58 cents for every dollar earned by white men.76 While those figures have improved a bit for women of color in the last few decades, they haven’t for men. Black men made the same portion of what white men did in 1980 as they do now.77
As with the gender pay gap, this is a complex problem with debatable causes and solutions. What should be clear, though, is that it’s a very real problem that it isn’t going away.
How CRR Would Help
: By boosting the pay of all low-wage workers and lowering the rankings of any company found discriminating by race, CR Rankings should do more to shrink the racial pay gap than anything else we’ve done in the last half-century.The two main metrics factored into the Workers ranking—Distribution of Wealth and Pay Relative to Local Standard of Living—would go a long ways towards combatting income inequality. Because these metrics would help boost the pay of all low-wage workers, CRR should help blacks and Hispanics more than everyone else because blacks and Hispanics disproportionately occupy those lower-wage jobs. Thus, the Workers CR Ranking can do a lot help people of color catch up to everyone else in pay.
A secondary but also quite important impact of these metrics would be better education. Public schools are funded in large part by local property taxes. Poor neighborhoods tend to have less funding for their schools simply because the people there are poorer and thus pay less in those property taxes. This means poorer children usually go to worse schools than everyone else, a big barrier if you want them to get a good education and go on to better jobs than their parents had. With CRR pushing companies to better pay those low-wage workers, though, those higher wages would steadily bring in more funding to local schools. Not only would people working lower-wage jobs make more money, their kids would also go to better schools and thus have a better chance at getting even higher-wage jobs themselves. Again, this should disproportionately help those races more concentrated in lower-wage jobs, i.e., blacks and Hispanics. Making more money also gives those families a better chance of then sending their kids to college, reducing another of the critical roadblocks to people of color in advancing to better-paying jobs.
On top of these measures, CRR would also create two shadow rankings to track the racial pay gap at all corporations. One would track pay, the other pay raises by race. These racial pay shadow rankings would not automatically factor into all companies’ CR Rankings (for fear of creating perverse incentives, as described in greater depth in Additional Notes), but they would provide invaluable evidence to the CR Bureau in discovering and punishing clear pay discrimination. As part of the Additional Factors metric for the Workers ranking, the CRB would have the power to dock the rankings of any companies it viewed to be racially discriminatory in the payment of its employees, using direct testimony from employees, these shadow rankings, and any other available evidence.
The racial pay gap is no doubt a tough problem to break down and fix, but CR Rankings should start making great strides towards doing exactly that.
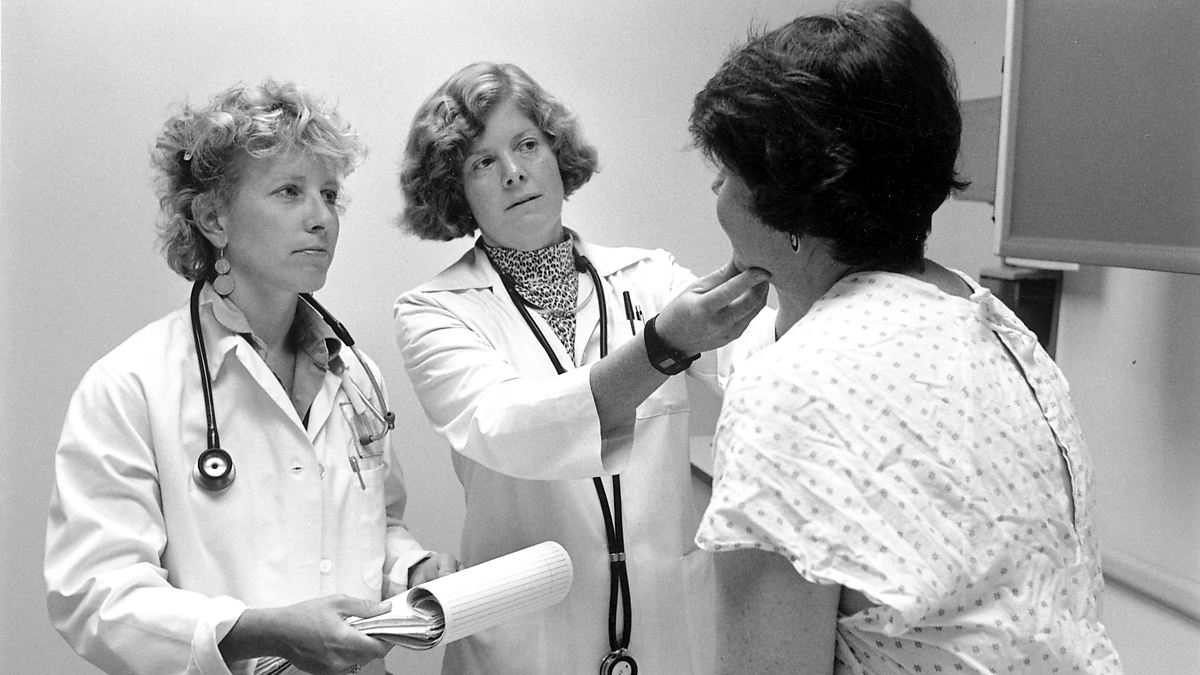
National Health Care Bill
The Problem
: We pay more in the US for health care than anywhere else in the world, and that price tag continues to rise. These soaring prices make insurance too expensive for many to afford and it’s adding huge sums to our national debt.
Kristopher Radder/US Navy
Here in the US we have some of the best doctors and technology in the world, but our health care system is also a tangled, expensive mess. We now pay over $10,000 per American citizen per year for health care,78 easily the highest cost per capita in the world. That being said, we aren’t necessarily healthier than those countries that spend less. According to a 2015 ranking of health commissioned by the United Nations, the US ranked just 28th globally, well behind plenty of countries that spend a small fraction of what we do each year.79,80
How CRR Would Help
: By encouraging companies to produce fewer toxic chemicals, pay their workers more, and better protect their workers’ safety and health, CR Rankings would help make millions of workers healthier. These steps should also take a big bite out of our country’s massive health care bill.There are plenty of reasons our health care costs have spiraled out of control. CRR wouldn’t help many of these factors, like keeping doctors from overusing expensive tests and procedures. However, there are plenty of ways it would significantly help.
- Fewer toxic chemicals – Our modern world surrounds us with all kinds of chemicals that can do us harm. Pesticides from farms, smog from factories, exhaust from cars, leaks from landfills, and all the things we buy and put in our homes—these all contain plenty of toxic chemicals. These chemicals can then lead to higher incidences of all kinds of health problems, from asthma to Alzheimers, lower IQ to cancer.81 According to a 2016 study, such chemicals cost the United States alone an estimated $340 billion a year in health care costs and lost wages.82 Because CR Rankings reward companies that use (and sell) fewer harmful chemicals, over time we should see a large reduction in the harmful chemicals around us. Simultaneously, we should see a reduction in the huge medical costs that those chemicals bring.
- Better pay – One of the often-ignored byproducts of poverty is poor health. When you’re working twelve hours a day to just barely scrape by, you don’t really have the time to go jog in the park or the money to buy more healthful food. By encouraging bigger paychecks for lower-wage employees, though, CRR would make a huge difference in the health of the poor. They could then afford more nutritious food and, by not having to work so many hours, have the free time to exercise more and take better care of their bodies. As an added bonus, they could also much more likely afford health care. Health care costs often rack up when the uninsured make frequent emergency room visits. Give that person health insurance, have them come in for cheaper preventative care, and those expensive emergency room visits plummet. It’s a win-win. Better health for the people, and lower costs for the health care system.
- More Concern for Employees’ Health – Another big way CR Rankings should lower the nation’s health care bill is by incentivizing companies to better promote their employees’ health. Currently most businesses tend to see their role in their employees’ health as, well, if there’s anything extra we can do to help, great…but the job definitely comes first. This account is due in three weeks, so you can come back to the whole sleeping, jogging, and eating well idea after all those pizza lunches and twelve hour days hunched over your desk are over. CRR would turn that picture around by tying the health of a company’s employees to its profits. As part of the Worker Safety & Health Questions, CRR would have every US employee answer how well its employer:
- Provides nutritious food and beverage options
- Allows free time and scheduling flexibility to fit in physical exercise
- Manages stress levels
- Keeps the workplace free of toxic chemicals
- Provides safe housing and equipment
Antibiotic Resistance
The Problem
: Bacterial infections are becoming resistant to the antibiotics we have to treat them, killing hundreds of thousands a year. Meanwhile, drug companies don’t want to research new antibiotics because it doesn’t really make them money, so the problem is only poised to blow up in the coming decades.Antibiotics are medicines that kill or inhibit the growth of bacteria. Used properly, they can stamp out harmful bacterial infections and make otherwise dangerous operations safe, like surgery and childbirth. Since their first discovery in 1928, antibiotics have saved tens if not hundreds of millions of lives.83
Bacteria evolve quite quickly, though. Put them in the presence of an antibiotic and any of the bacteria that live to tell the tale may have developed a resistance to that antibiotic—that is, an immunity to it. Get an infection with those resistant bacteria, and that antibiotic will be worthless.

NIAID
Because antibiotics are used regularly worldwide, antibiotic resistance has also unsurprisingly become a huge problem worldwide. The World Health Organization has reported widespread resistant bacteria found to drugs for tuberculosis, pneumonia, malaria, gonorrhea, urinary tract infections, bloodstream infections, and even HIV.84 Around 700,000 people die from antibiotic resistant infections each year.85 If that sounds bad, the problem looks to get much, much worse in the coming years. According to a two-year study of antibiotic resistance commissioned by the United Kingdom, annual deaths are on track to balloon to ten million by 2050, at which point the problem will cost the world an estimated $3 trillion a year.86
The scariest thing about antibiotic resistance, though, is that we’re doing almost nothing about it. New antibiotics take a lot of research (a.k.a. a lot of time and money) to discover, and in the last couple decades pharmaceutical companies have essentially decided that it isn’t worth all the money. So hardly anyone is working on creating new ones. Meanwhile, early in 2017 a Nevada woman died from an infection that was resistant to all 26 antibiotics available in the US.87 Luckily it didn’t spread to anyone else, but when one does we could be in for a deadly pandemic.
How CRR Would Help
: By classifying antibiotics used without a prescription as Non-Greenhouse pollutants, CR Rankings would discourage their overuse. Also, because innovation points would be awarded to companies that develop new antibiotics, the dwindling global supply should steadily replenish.One of the biggest drivers of antibiotic resistance is unnecessary antibiotic use on farms. Currently, 80% of the antibiotics made in the US are consumed by livestock, not people.88
You might be thinking, oh, well that probably isn’t so bad. Bless those kind farmers for trying to keep their cattle, chickens, and pigs so healthy! But the rationale for antibiotic use on farms isn’t kind; it’s lazy and cheap. The modern farm utilizes most of its space and resources with such breathtaking efficiency that it hardly gives its animals the room to move inside tight pens and cages. Have stressed, unhealthy animals stand around all day inside poorly ventilated buildings on a floor littered with their own feces, and you’ve just created a perfect breeding ground for bacterial infections. Rather than take the slightly more costly route of giving their cows and chickens the proper space, nutrition, and veterinary care to prevent such infections, though, modern farms tend to instead give their animals regular doses of antibiotics in their water and feed. These regular antibiotic doses stave off what would no doubt be quite frequent infections (and, as an added bonus, spur the animals to grow faster), but they also creates a breeding ground for antibiotic resistance in every antibiotic-fed farm animal.
With CR Rankings, antibiotics used without a medical prescription would be considered pollutants under the Non-Greenhouse Pollution metric. The more farms use them, the more it would lower their CR Rankings. This would finally give agribusinesses a strong financial incentive to phase out heavy antibiotic use on its livestock (which would in turn slow the creation of antibiotic resistant bacteria).
Then of course there is the other major driver of the antibiotic resistance crisis: the lack of new antibiotics. With CR Rankings, innovation points would be awarded to any companies that develop effective new antibiotics. Those points would then translate to higher CR Rankings. Thus, CRR would revitalize the otherwise dying profit motive needed to ensure that new antibiotics are made. Thus, by reducing the overuse of antibiotics and encouraging the production of new ones, CRR would become a major force in ending antibiotic resistance.
Nuclear Waste
The Problem
: Nuclear power is greener than some alternatives, but its waste is incredibly dangerous and expensive to store.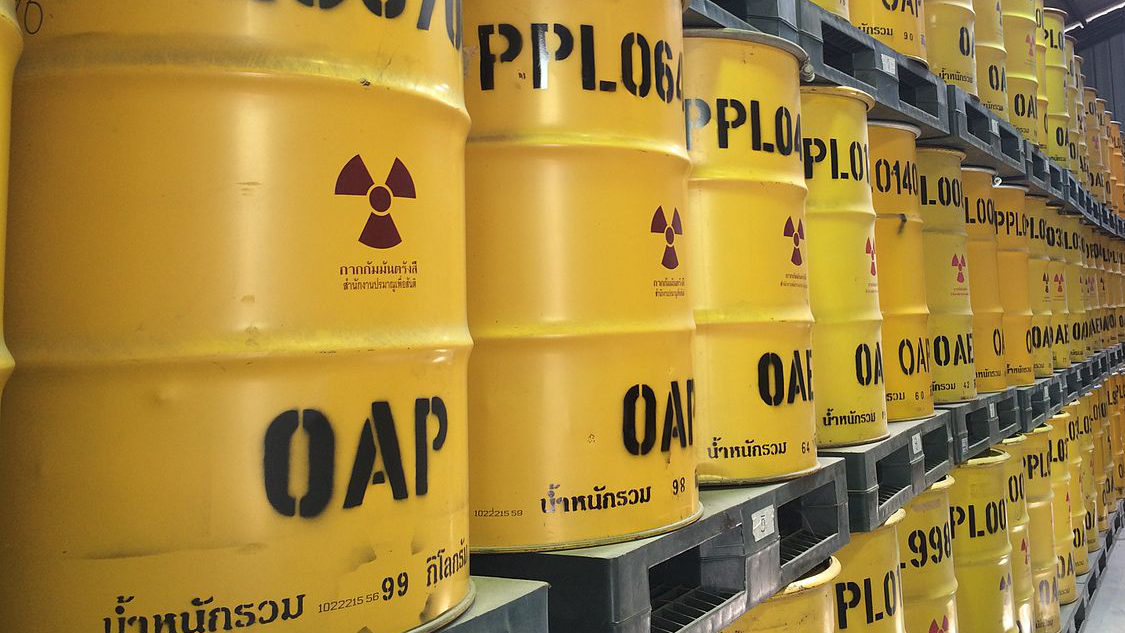
D5481026/Wikipedia
Nuclear power plants work by exploiting nuclear fission. Take some giant, unstable atoms like uranium, whack ‘em with some tiny little neutrons, and the giant atoms split in half. That releases a ton of energy, energy that can then be used to boil water, spin turbines, and thus generate electricity. The benefit of nuclear power is an almost nonexistent carbon footprint compared to quite dirty coal and oil. The problem, though, is those halves of atoms left over are still quite radioactive—and will continue to be for thousands of years to come. Anyone exposed to that waste will acquire a much higher risk of cancer. While we have developed quite safe ways to store that nuclear waste, it’s also extremely expensive ($38 billion so far in the US89), creates a massive headache for finding places to put it, and creates a terrorism risk for anyone looking for something to extra harmful to blow up.
How CRR Would Help
: The radioactive waste of nuclear power plants would lower the Environment score of companies that use that power. Businesses would thus be motivated to locate near greener power plants like wind and solar. In turn, governments would be motivated to build more such greener power plants and eventually phase out nuclear.Thanks to the Non-Greenhouse Pollution metric, the more hazardous pollution a company creates, the lower its Environment ranking. That includes the pollution of any power plants that those companies use for electrical power. Your factory’s located near a coal power plant? Sounds like some cheap electricity, sure. But for whatever percent of that coal plant’s electricity you use, you’ll be held accountable for the same percent of that plant’s pollution, too. Businesses that use nuclear power wouldn’t be docked much for carbon dioxide, but they would be docked for the nuclear waste. CRR’s Environment rankings would thus push businesses away from the dirtiest power sources like coal, but also away from the still hazardous nuclear. All that money we spend burying radioactive waste could thus go into building safer, greener power plants. Sounds like an all-around win.
Child Labor
The Problem
: Many millions of children worldwide work jobs that keep them out of school and thus stuck in poverty.
IRRI Photos/Flickr
“Child labor” isn’t just anytime a young person has a job. It isn’t, in other words, voluntarily working the register at mom and dad’s restaurant for a couple hours after school. We instead call it child labor when it’s harmful for the child. That means work children are simply too young to be doing or, as UNICEF puts it, work that “may compromise their physical, mental, social or educational development.” That can be anything from child prostitution to twelve-hour days on a coffee plantation to a factory job that exposes kids to chemicals that stunt their growth. The International Labour Organization estimates that 168 million children age 5-17 fit that bill in 2013.90 That’s the equivalent of every other person in the entire United States working in child labor.
Of course, we shouldn’t just lament the loss of playground time and childhood innocence. Child labor is probably the easiest way to keep someone from getting an education and rising up from poverty. It also frequently leads to developmental disabilities, malnutrition, physical mutilation, drug abuse, depression, and other psychological problems.
How CRR Would Help
: Any company found using child labor would have its Workers ranking docked.Child labor is generally an off-the-books kind of problem. Most businesses employing children for long hours won’t report that they’re doing so to any government. To some degree, this limits what CRR can do to help. If businesses don’t report something, that something won’t make it into CRR’s automatically calculated metrics.
That being said, any evidence showing that a business uses child labor will lead to rankings deductions through the Additional Factors metric. (And deductions for any unreported, most likely hidden irresponsible behavior like child labor will be much steeper than deductions for honestly reported behavior.) One important priority with CR Rankings will be a simple, publicly anonymous online system through which anyone worldwide can submit information about a company and how responsibly it is acting. This can be in the form of photos, video, quotes, observed data, testimonials, etc. Any company trying to hide widespread child labor will find it a bit hard to do so in an age of CR Rankings and ubiquitous camera phones.
Cancer Rates
The Problem
: Cancer causes one in every six deaths, making it the second leading cause of death in the world.91 It is also our most expensive disease, costing us an estimated $895 billion each year.92How CRR Would Help
: CR Rankings would lower cancer rates by encouraging businesses to first stop selling cigarettes and produce fewer carcinogens overall. It would also encourage them to give their employees more healthful food, more time to exercise, better protection from toxic chemicals, and better pay. With these steps, CRR would reduce many of the biggest risk factors for cancer.Much of what determines your cancer risk falls to your own choices—what you eat, how much you exercise, how much exposure you get to the sun, how much you smoke. Lowering the risk of cancer is therefore largely up to you. You choose whether or not to smoke. You choose whether or not to exercise, to put on sunscreen, etc.

Foundation Vanessa Isabel/Wikipedia
However, there is still quite a bit that our businesses do that influences those cancer rates. CR Rankings would push companies to lower risk factors in many ways, which should overall lower the rate of new cancers developing each year.
- Carcinogens – Perhaps the most important way CRR can fight cancer is to encourage businesses to phase out the use of carcinogenic substances, that is, ones that increase the risk of cancer. With the Non-Greenhouse Pollution metric, the more toxic chemicals a corporation produces and/or buys, the lower its Environment ranking. Businesses would thus be motivated to produce less of a wide variety of such chemicals: synthetic pesticides, dioxins, vinyl chloride, benzene, formaldehyde, heavy metals. That change would most directly benefit the employees who work around these chemicals every day, but would also benefit the rest of us, too, though. Most of these synthetic chemicals we manufacture don’t break down easily in nature (or at all). They thus continue to build up in our atmosphere, oceans, soil, groundwater, and, yes, our bodies too. By limiting the number of carcinogens companies produce, we should over time start to see fewer harmful chemicals in the environment and thus fewer new cancer cases.
- Cigarette sales – Corporations wouldn’t just have their rankings docked for producing carcinogens. They would also get lower rankings for selling them, too. Probably the biggest consumer product this would affect is cigarettes. For selling carcinogenic products, tobacco companies would get low CRR marks, sure, but so too would any store that chooses to sell them. Some stores have already made the bold choice to discontinue the sale of cigarettes given their ill effects on health, CVS being a prime example.93 With CR Rankings, many more stores would no doubt follow suit once it became clear that dropping cigarettes would mean higher rankings. Fewer stores selling cigarettes means fewer people smoking and thus, less cancer.
- Giving time for physical exercise – As part of the Worker Safety & Health metric, all US employees would be asked how well their employers allow them the free time and scheduling flexibility to fit in physical exercise. Companies would thus have good reason to make sure their employees get that free time and flexibility. The more people we would then have exercising more often, the lower the cancer risk.
- Ensuring employees have access to healthful food options – Another question given to all US employees would be how well do their employers provide healthful food and beverages at work (and/or make it easy for the employees to provide those healthful options themselves). The higher the marks, the higher the Workers ranking. It would therefore benefit companies to move towards healthier lunch, snack, and drink options around the office, which could make a big impact on our nation’s diet. More healthful diets mean a lower cancer risk.
- Give employees better protection from toxic chemicals – According to the Centers for Disease Control, 3-6% of cancers are caused by workplace exposure to such carcinogens, meaning hundreds of thousands of deaths each year.94 However, even as companies decrease toxic chemical use thanks to the Non-Greenhouse Pollution metric, they will still no doubt have to use some such chemicals. That means there will still be some workplace exposure. To help combat this remaining cancer risk, all employees would be asked how well they feel their employers keep the workplace safe from hazardous materials and chemicals. Their answers would then factor into all Workers rankings. That would give businesses not only an added bonus to remove all potential carcinogens, but also the motivation to better protect their employees from the chemicals that must be used. That could mean better facemasks and better ventilation systems. It could also mean better separation from those chemicals, e.g., spraying them with robotic equipment while the human operators sit far away.
- Higher pay – Perhaps the least obvious way CR Rankings would impact cancer rates is by increasing the pay of lower-wage workers. Getting paid more should mean those workers would, on average, be able to a.) buy more healthful food, b.) physically exercise more often, c.) afford health care, and d.) have more time for more preventative cancer screenings. All of these changes would mean these now better-paid workers should develop fewer instances of cancer. There is also a fairly high correlation between income and smoking. Those living at or below the poverty level are over 50% more likely to smoke cigarettes,95 likely to cope with the added stress of being poor. Increase their pay and they would be less likely to smoke (and thus less likely to develop the respiratory cancers associated with smoking).
- More money for research – With the Charitable Giving metric, companies would be encouraged to give more money to all kinds of good causes. That includes charities that fund cancer research. With more money, such research could no doubt move more quickly to better, more effective treatments and possibly even someday outright cures.
Put all of these influences together, and CR Rankings should provide a big push to lower cancer rates. That would mean in the long run saving many billions of dollars and, more importantly, saving many thousands if not millions of lives.
Funding for Charities
The Problem
: The problems here are any of the various problems our charities fight against – homelessness, hunger, sickness among the uninsured, inadequate education, environmental conservation, cancer research, etc.How CRR Would Help
: US corporations made almost two trillion dollars in 2015 but only gave a tiny sliver of those profits (0.98%) to charity.96-98 With the Charitable Giving metric in the Community ranking, CR Rankings would encourage companies to compete to see which of them could give the largest percentage of their profits to charity. That should mean a huge boost in funding for all kinds of great causes.Outdoor Air Pollution
The Problem
: Over three million people die prematurely every year thanks to outdoor air pollution, a number that is set to double by 2050 if the current trend continues.99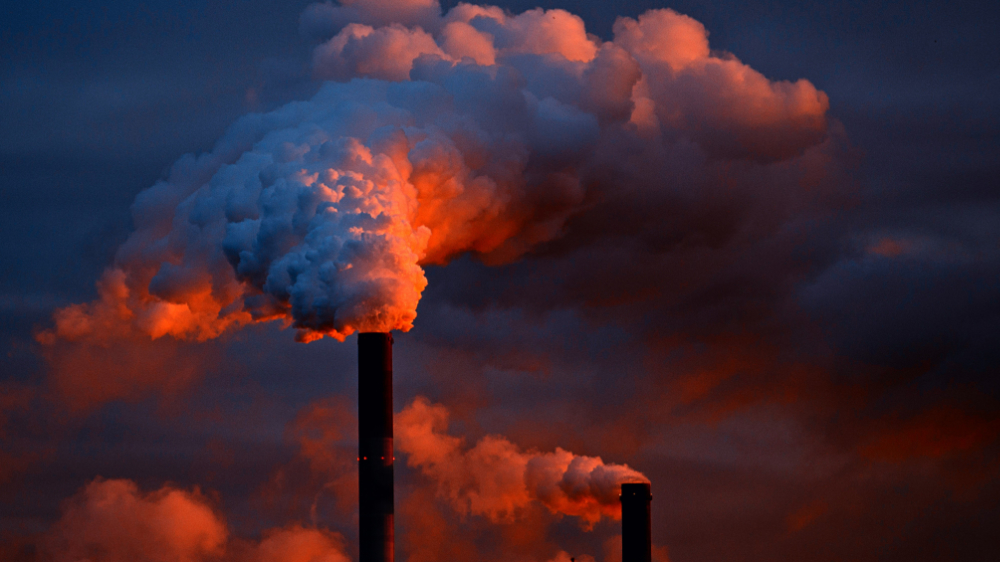
JuergenPM/Pixabay
We often refer to outdoor air pollution as “smog,” the brownish haze that settles over so many large cities. Outside of cities our air is still quite full of pollutants, though, even when we cannot see them. Burning fossil fuels in our power plants, homes, and cars creates most such pollution, while ammonia from farms and a random assortment of chemicals from factories and from incinerating trash don’t help. This pollution leads to higher rates of all kinds of illnesses, from the mild (like asthma) to the deadly (like heart attacks).
How CRR Would Help
: By encouraging companies to burn fewer fossil fuels, produce less ammonia, and create fewer other air pollutants, CR Rankings would make huge progress in reducing outdoor air pollution.Many deaths from outdoor air pollution arguably fall outside of CRR’s reach. Natural pollution like dust is a big problem in drier areas of the world like the Middle East. In Asia, the smoke from burning wood, diesel, and coal at home can be particularly dangerous.
However, CR Rankings would address many of the major sources of outdoor air pollution. About forty percent of the deaths from outdoor air pollution stem from the combined emissions of farms, power plants, and cars.100,101 On farms, fertilizers and the urine from livestock both create ammonia gas. That ammonia then combines with nitrogen and sulfur byproducts—which are created by burning fossil fuels in power plants and cars—to form tiny, harmful particles called PM2.5s. These PM2.5 particles (i.e., particulate matter smaller than 2.5 microns wide) are especially dangerous because, by being so small, they can penetrate deep into the lungs and be absorbed into the bloodstream. Such harmful particles, as well as NO2 from diesel engines, all increase the risk of premature death from heart and lung failure, as well as from cancer. There’s also ozone, the common byproduct of sunlight plus air pollution, which creates respiratory problems when created near the surface of the earth. Add in all of the other assorted pollutants created by our vehicles, power plants, and factories, and we have another classic GCM problem in outdoor air pollution. To fix it we need to give people the proper motivation to stop contributing to the problem.
With the Non-Greenhouse Pollution metric, CRR would push businesses to reduce their production of these harmful gases and particulates. Specifically, companies would be rewarded for:
- Reducing fossil fuel consumption by driving and flying less, by switching to hybrid or electric vehicles, and by using less electricity. Companies would also be pushed to cut fuel consumption all the more by the Carbon Footprint metric.
- Locating near renewable power plants (because by not burning fossil fuels they wouldn’t produce nitrogen and sulfur oxides). This would in turn reward municipalities that switch to more renewable energy because doing so would attract more businesses to set up shop there.
- Using less fertilizer to reduce the amount of ammonia gas released into the atmosphere
- Shifting from livestock to more plant crops to as well reduce ammonia gas production
- Stop incinerating trash to stop producing dioxins, carbon monoxide, carbon dioxide, mercury, lead, nitrogen oxides, and other harmful pollutants
- Producing less of every other type of air pollution
By encouraging all businesses to take these steps bit-by-bit, year-by-year, CR Rankings would over time greatly reduce the amount of outdoor pollution being created. CRR could also in the process save thousands if not millions of lives.
Cultural Eutrophication
The Problem
: When businesses dump nutrient-rich fertilizers and wastes into our rivers and lakes, algae and plants grow out of control and kill off everything else. That spoils our waterways, hurts fishing and tourism industries, and costs us a ton of money.Cultural eutrophication occurs when—thanks to us humans—too many nutrients enter a body of water. This most often happens when farms put too much fertilizer on their fields (which then washes downstream) or when sewage pipes pour directly into rivers and lakes. Plants and algae in the water gobble up those excess nutrients, grow explosively, block out the sunlight, and use up all of the oxygen. Some, maybe even all, of the other aquatic organisms then die out. And as we travel closer to the ocean the effects get much worse. As rivers combine their waters, they also combine all that fertilizer and sewage.
Because of eutrophication, bodies of water like the Chesapeake Bay have for decades now had large “dead zones,” i.e., areas of the water with such low dissolved oxygen levels that very little can live there. And these dead zones are rapidly growing. After the number of dead zones has roughly doubled every decade since the 1960s, we now have hundreds of them.102 They now cover about 95,000 square miles of ocean103 and dot the entire US Gulf of Mexico and Atlantic Ocean coastlines.104
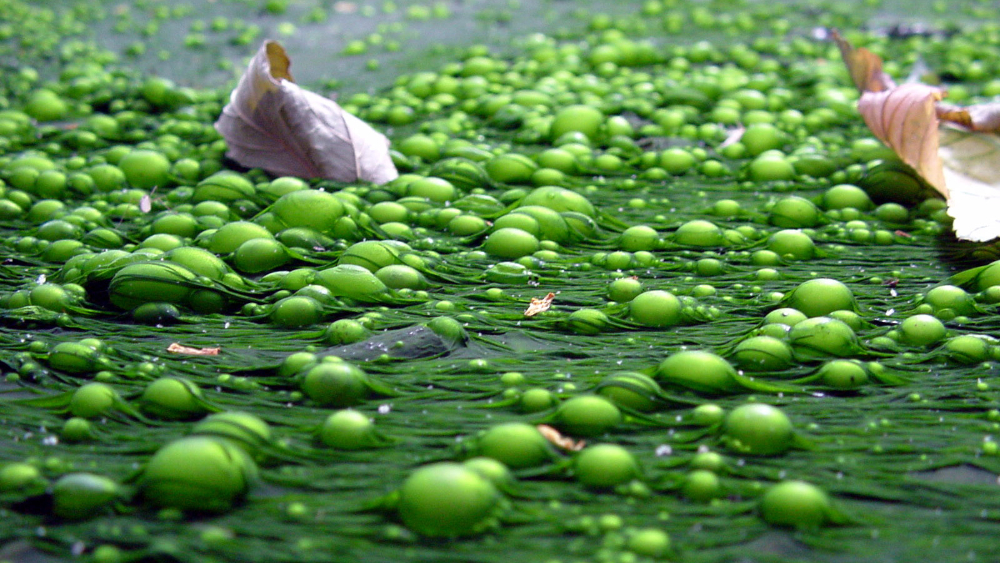
F. Lamiot/Wikimedia Commons
Eutrophication is obviously bad for the body of water in question, but it’s also plenty bad for us humans by association. Fish, crabs, lobsters, shrimp, and any other species we harvest as seafood get hit pretty hard by eutrophication, which means the fishing industry gets hit pretty hard by it, too. Tourism takes a hit when your local waters look a murky brown and green (and are thus bad for swimming). Also, when those freshwater sources give you your drinking water, all of that algae means much more expensive filtration. All told, the estimated cost of cultural eutrophication in the United States alone is $2.2 billion annually,105 and with the continuing growth of fertilizer use worldwide, the problem of eutrophication only stands to get worse.
How CRR Would Help
: Fertilizers, livestock waste, and industrial sewage would, like any other pollution, bring down a company’s Environment CR ranking. Farms and factories would thus be motivated to produce less and better manage each of those main causes of eutrophication. That means far healthier rivers, lakes, bays, and oceans.CR Rankings would motivate businesses to produce less of and better manage the substances that lead to eutrophication: synthetic fertilizers, animal waste, industrial sewage, and nitrogen oxides.
- Synthetic fertilizers – Farms regularly use much more synthetic fertilizer than they need because it’s cheap and they want to make sure their crops get enough nutrients. That’s a problem, though, when the excess washes into the nearby stream. Meanwhile, there are plenty of things farms can do to minimize this erosion—contour farming, riparian buffers—but why go to all that trouble when the effects of eutrophication a hundred miles downstream won’t affect you? CR Rankings would change all of that by considering excess fertilizer a pollutant under the Non-Greenhouse Pollution metric. Farms would thus be motivated to use less fertilizer and to take whatever steps necessary to make sure that what fertilizer they do use doesn’t wash downstream.
- Livestock waste – When you raise cows, chickens, pigs, and other livestock, you inevitably get plenty of unwanted feces. There’s simply no way around it. And as meat production has reportedly tripled worldwide over the last forty years106 that means triple the manure to deal with. Farms tend to use that manure as fertilizer on fields or to pool it up in a lagoon, but the more of it there is the more easily it can wash down into streams and lakes. CRR would consider any manure used beyond an appropriate level of fertilizer as a pollutant under the Non-Greenhouse Pollution metric. To raise its Environment ranking, farms would be motivated to better manage that manure and/or make less of it (i.e., switch to more plant crops).
- Aquaculture waste – Just like other livestock, fish and shrimp grown on farms produce plenty of nitrogenous waste too. Fish farming has boomed in recent decades—worldwide production is up 1160% in the last thirty years107,108—meaning much, much more waste that gets dumped straight into our aquatic ecosystems. As with other manure, aquaculture waste would be considered pollution for a company’s Environment ranking, provided it finds no productive, non-harmful way to use that waste.
- Industrial sewage – Just like a city has wastewater it has to dump somewhere, industrial sites like paper mills and food processing plants do too. When that sewage is rich in nutrients and dumped straight into waterways, it can cause eutrophication. Such unprocessed nutrient-rich sewage would be considered pollution under the Non-Greenhouse Pollution metric, thus motivating such businesses to better manage their waste.
- Nitrogen Oxides – Last but certainly not least we have nitrogen oxides, a byproduct when we burn fossil fuels. Coal-fired power plants and automobiles pump these chemicals up into the air, after which they inevitably come back down in rain, snow or dry deposition (i.e., simply falling back down on their own). These nitrogen oxides then enter our bodies of water, at which time they feed plants and algae and drive more eutrophication. Thanks to the Non-Greenhouse Pollution metric, nitrogen oxides would bring down a company’s Environment ranking. So too, of course, would burning fossil fuels in the first place thanks to the Carbon Footprint Businesses would thus have a strong incentive to reduce their nitrogen oxide production.
All told, CR Rankings would push businesses quite a bit to reduce and better manage their fertilizer, animal waste, sewage, and nitrogen oxide production. That in turn would do quite a bit to reduce eutrophication. We should therefore see fewer new eutrophic dead zones, if not many dead zones coming back to life. That should save us quite a bit of money and greatly improve the health of our lakes, rivers, bays, oceans.
Ocean Acidification
The Problem
: The CO2 we create from burning fossil fuels is making our oceans much more acidic. That higher acidity hurts marine ecosystems and could eventually lead to the complete destruction of our oceans’ coral reefs.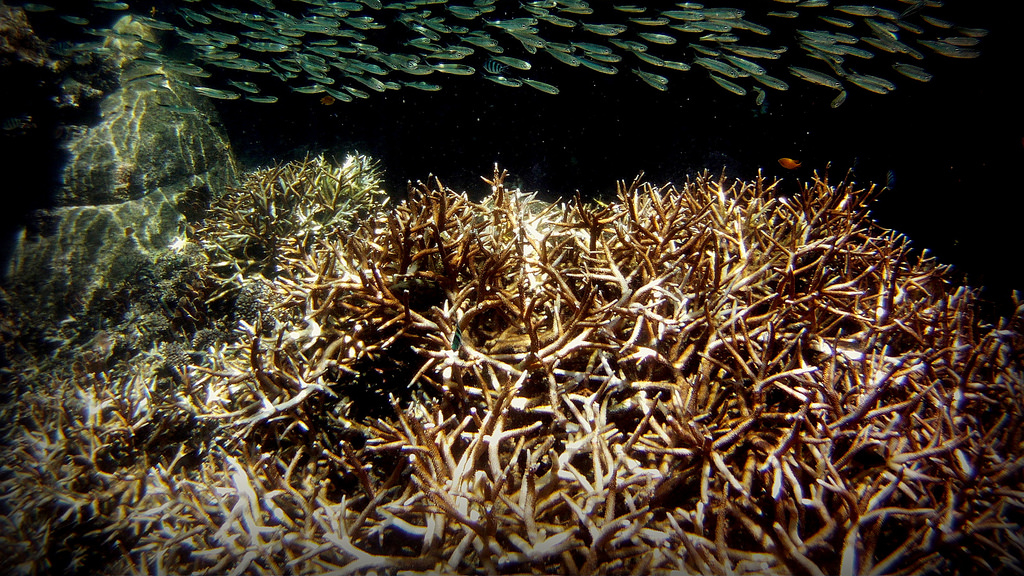
Petchrung Sukpong/Flickr
Increased CO2 in the atmosphere hasn’t just led to warmer temperatures. It has also increased the carbon dioxide levels in our oceans. And the problem this time isn’t warmth—it’s acid. Combine CO2 and water and you get carbonic acid. Thus, the more carbon dioxide in our oceans, the lower the pH levels. NOAA estimates that Earth’s ocean water has become about 30% more acidic since the beginning of the industrial revolution and that it is poised to become another 150% more acidic by 2100, should current fossil fuel-burning CO2 trends continue.109
While we don’t know the full effects of such a huge jump in acidity—one that would make our oceans more acidic than they have been in over 20 million years110—we do have a fairly good idea. Increased acidity first hits many marine species that depend on calcium carbonate for hard, shell-like protection (e.g., oysters, clams, sea urchins, coral, and some plankton). That kills many members of those species, which then kills whatever eats them, plus whatever eats what eats them, and so on. Plankton in particular are the foundation of the oceanic food web, and a recent study by researchers at MIT showed that acidification could drastically disrupt the world’s plankton populations,111 a change that would likely in turn drastically disrupt everything else living in the oceans.
Meanwhile, perhaps still the biggest impact of acidification is the destruction of the world’s coral reefs. Our coral reefs are already steadily shrinking. Most of the blame goes to the warming of our oceans (which, not surprisingly, is caused by climate change). Half of the Great Barrier Reef’s living coral, for example, has died since 1985.112 Higher acidity is another major cause of the problem, too, though. Scientists recently found that at pre-industrial pH levels the GBR’s coral would be growing about 7% faster.113 As acidification is poised to accelerate in the coming years, the destruction of our coral reefs is poised to follow. In addition to losing some of the most beautiful places on our planet, losing our coral reefs would also mean losing a vital habitat for fish populations, food for many marine species, and shoreline protection from erosion. In 2014, the U.N. Convention on Biological Diversity released a report estimating that the costs of losing ecosystem protections like coral reefs could reach $1 trillion per year by the end of the century if we don’t change course.114
How CRR Would Help
: CR Rankings would strongly discourage the production of carbon dioxide. By doing so, CRR should help dramatically slow, if not one day totally stop, the acidification of our oceans.The Carbon Footprint metric ranks companies by how much they contribute to global warming. Most of that contribution, of course, comes from carbon dioxide gas. With CRR in place, companies would be financially encouraged to steadily produce less and less CO2. Less CO2 in the air would directly lower the CO2 levels in our oceans, thus slowing the increase in acidity. Given enough time, this acidification trend could even stop or reverse (with any corporate-funded initiatives to capture carbon from the atmosphere and oceans), putting our oceans on track to restore their pre-industrial pH levels. That would save our coral reefs, revitalize our marine ecosystems, and save us what could be many trillions of dollars.
Wetland Destruction
The Problem
: Wetlands like marshes and swamps filter our water, prevent flooding, trap carbon, and host an incredible variety of life. Thanks to global warming and new development, though, our wetlands are steadily being destroyed.A wetland is any place where water covers the soil: marshes, ponds, swamps, bogs, deltas, frequently flooded lowlands, and the edges of lakes and oceans. While wetlands may just seem like muddy, gross, and unimportant places, they are actually one of our most vital ecosystems. Wetlands filter pollutants out of water. They greatly lessen flood damage by acting as a sponge and soaking up excess water. They protect coastlines from erosion, and they absorb carbon dioxide that otherwise exacerbates climate change. Similar to rainforests and coral reefs, wetlands also teem with a much greater biodiversity than most ecosystems. That abundance of life makes wetlands vital to the vast number of species that live there, sure—from cranes to crocodiles—but also makes them especially critical to the greater health of the world. Nearly half of all endangered species depend on wetlands for habitat and food.115

Karney Lee/USFWS
Meanwhile, thanks to human activities our wetlands are disappearing. Global warming raises sea levels and thus drowns many wetlands with seawater. New housing, retail, and farming developments frequently fill in wetlands with dirt and/or pave them over. An overabundance of pollution in our water—sediment, fertilizer, pesticides, road salts, sewage, heavy metals, and more—can exceed the natural number of toxins a wetland can filter out, and thus start to kill off the species that live there. Despite conservation efforts by the government, the United States is losing about 90,000 acres of wetland each year and rising,116 a relatively quite high amount given the rarity of these ecosystems.
Of course, as usual we don’t just mourn the destruction of the environment because it mars beautiful places. It also quite directly hurts us. Lose wetlands and you have to build more dikes to protect from floods. You have to build more water filtration systems. Climate change becomes that much worse. Water recreation, fishing, bird-watching, rice farming and other industries dependent on wetlands also take big hits. All of that costs a lot of money. Hurting our wetlands hurts ourselves.
How CRR Would Help
: Destruction of wetlands would lower a company’s CR Rankings, as would adding to the pollution that weakens the wetlands that still exist. Over time, CRR could thus spark a major turnaround for our disappearing wetlands.As part of the Additional Factors metric for the Environment rankings, the direct destruction of wetlands would lower a company’s CR Rankings. Helping to preserve wetlands by leaving them alone—that is by building farms, factories, office buildings, roads, and parking lots somewhere other than on wetlands—would improve any business’s rankings. Actively contributing to wetland restoration projects would raise that business’s rankings even more.
The Carbon Footprint metric would also help to protect wetlands. Slowing climate change would mean slowing sea level rise, which would protect all of the low-lying wetlands vulnerable to higher sea levels. As well, the Non-Greenhouse Pollution metric would encourage companies to gradually phase out all toxic chemicals. That would ease the excessive number of toxins that our wetlands currently have to filter out and thus improve the health of the wetlands still in existence.
With all of those metrics put together, CRR would give companies a financial incentive to help preserve wetlands, a potential game changer for this fragile but quite necessary ecosystem.
Obesity Rates
The Problem
: Currently, more than a third of adult Americans are obese. Obesity leads to a host of other health disorders, soaring health care costs, and high rates of premature death.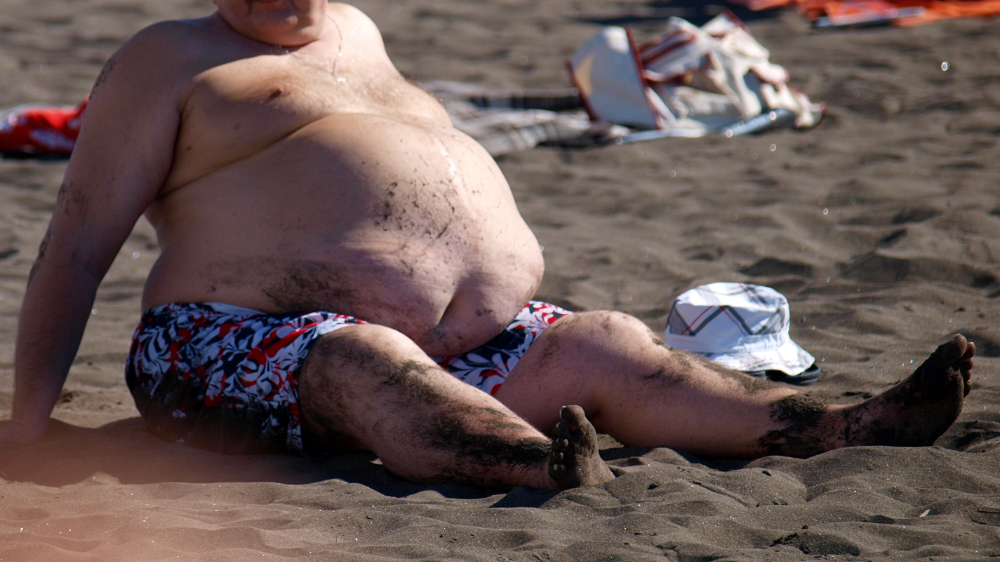
Tibor Vegh/Wikimedia Commons
If asked about the negative effects of obesity, most would say it’s embarrassing to be so overweight. That may very well be true, but the long-term consequences are much worse. Obesity leads to a higher risk of high blood pressure, type II diabetes, heart disease, stroke, mental illness, cancer, and death (among others).117 In fact, one of the best ways to shorten your lifespan is to carry excess body fat. According to a joint study by Stanford and Cambridge universities, every increase of 5 points in BMI above normal is associated with, on average, a 31% higher risk of mortality.118 Given that two-thirds of Americans are overweight and one-third are obese, that amounts to a public health crisis.
The misery caused by obesity’s secondary ailments and premature death are reason enough to do everything we can to combat the problem. However, the economic picture makes the cause all the more necessary. Estimates put the annual health care cost of obesity at somewhere from $147 to $210 billion in the US.119 That’s up to a $650 yearly bill for every American to pay for the health complications of the obese.
How CRR Would Help
: Poverty, unhealthful food, and a lack of movement in our lives are three of the biggest causes of widespread obesity. CR Rankings would raise the pay of the poor, push companies to offer more nutritious food at work, and push them to give more time for their employees to exercise. CRR should likely therefore make a big dent in the obesity epidemic.Obesity has a clear correlation with higher-income countries. The United States, for example, is one of the richest countries in the world and is also one of the most overweight. Ironically, though, it’s the poor within those wealthier countries who are most likely to be obese. One recent study found, for example, that especially poor American counties (with a poverty rate over 35%) have obesity rates 145% higher than wealthier American counties.120 The exact reasons are complex, but one big one is that in the US the cheapest foods have the most calories. Also, our culture has us sitting much more than moving, and the poor don’t have the spare time or money to go join a gym. However the causes rank exactly, it’s clear that the poor in the US and other affluent countries are the center of the obesity epidemic.
By attacking income inequality with the Distribution of Wealth and Pay Relative to Local Standard of Living metrics, CR Rankings would reduce poverty. By combatting poverty in poorer countries, CRR would help alleviate hunger and malnourishment. By also combatting poverty in richer countries like the US, though, CRR would do quite a bit to reduce obesity. The poor here would have more money to buy more nutritious food and could spare more time off to exercise.
CRR would also target obesity by more directly encouraging better food and more exercise. With the Worker Safety & Health metric, CRR would question all employees about how well their employers offer nutritious food and beverage options. It would also ask how well their employers give the free time and scheduling flexibility to fit in physical exercise. All businesses would be ranked by how well their employees rate them on those two questions. Thus, businesses would be motivated to start providing more nutritious food options at the workplace and a more flexible schedule to fit in regular exercise. With the cumulative effects for workers across the United States and beyond, these questions would provide a big push towards reducing obesity.
Mountaintop Removal
The Problem
: Coal companies regularly now get their coal by blowing up the tops of mountains. This mountaintop removal (MTR) method permanently destroys the mountain, devastates the surrounding environment, and poisons the people living nearby.What you no doubt picture in your mind when you think of coal mining are traditional mines, tunnels that bore into the side of a mountain. These days, though, many coal companies opt for the easier and cheaper method of “mountaintop removal.” It literally means exactly what it sounds like. Explosives blow up the top of the mountain, crews remove all of that earth, and voila. The coal inside is exposed for easy extraction.
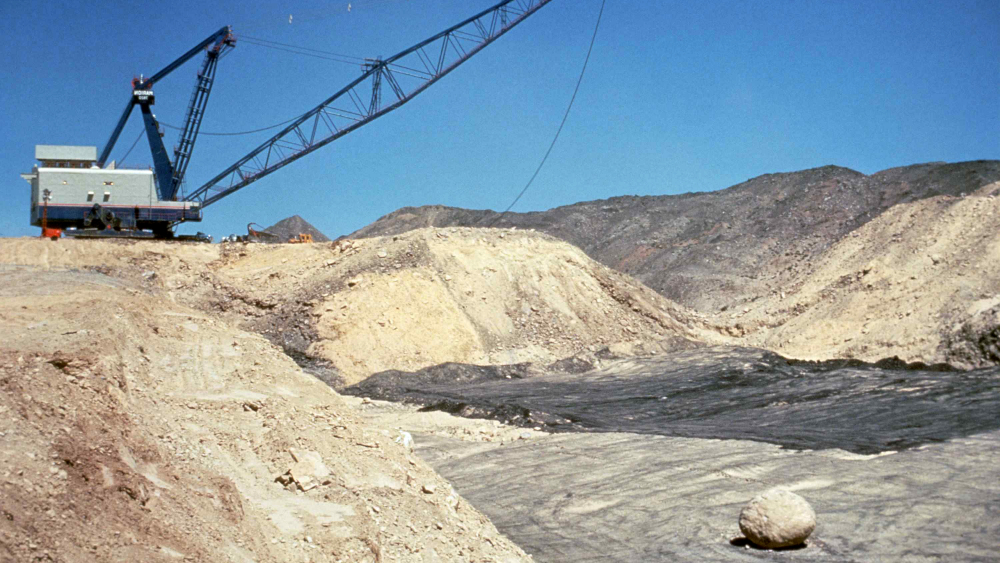
Allen Arthur/USFWS
However effective this approach may be for mining coal, it’s pretty across-the-board awful otherwise. For starters, MTR takes some of the most majestic, beautiful places we have and turns them into wastelands. By 2009, mountaintop removal had been used to alter or permanently destroy over 500 Appalachian Mountains.121 And it isn’t just the mountains that are destroyed. After removing the top five hundred feet or more of the mountain, the coal company generally then dumps that massive pile of often-toxic mining waste into surrounding valleys and rivers. This is referred to as a “valley fill” because it can literally fill the entire valley and flatten it. All told, the area’s mountain, valley, and aquatic ecosystems are devastated in the process. Forests there will likely take centuries to fully recover from being so wiped out. Even bird populations are affected, poisoned by eating poisoned fish.122
That isn’t all, though. Coal slurry—the leftover liquid sludge from coal processing, a mix that includes coal dust, water, and toxic heavy metals like arsenic, lead, mercury, and chromium—is also then left to sit in “impoundments” (a.k.a. giant open pits) somewhere in the area nearby, pits where the chemicals can seep into the groundwater or surge out all at once into the nearest stream if the dirt walls fail. In Kentucky in 2000, one such impoundment failure dumped an estimated 306 million gallons of slurry into the nearby Tug Fork River,123 making it over 30 times the size of the Exxon Valdez oil spill.124
All of coal slurry’s bad chemicals then (surprise surprise) end up making their way back to people. Twenty-one studies from 2007-2012 combined to show that those living near mountaintop removal sites were 42% more likely to be born with birth defects and 50% more likely to die of cancer than those living elsewhere in Appalachia.125
How CRR Would Help
: Any company that uses mountaintop removal would have its Environment ranking lowered. CR Rankings would also push businesses away from using coal in general. Together, CRR would have a strong effect in ending MTR.With the Additional Factors metric for the Environment ranking, corporations would be penalized for actions that permanently destroy the environment. Mountaintop removal would be high on this list of destructive actions. Thus, any business that gets its energy from MTR-mined coal would have its CR Rankings heavily docked. MTR is also an act almost impossible for any coal company to hide, thereby guaranteeing that any company mining this way would be punished with lower rankings.
Perhaps even more importantly, though, the Carbon Footprint metric would heavily punish companies the more they rely on power sources that contribute more to global warming, coal especially. That would eventually push coal power plants out of operation, thereby cutting off the economic demand for coal and therefore also the method of mountaintop removal used to get it. The Non-Greenhouse Pollution metric would furthermore dock the rankings of companies that dump the sediment and toxic metals left over after mining into nearby valleys and streams. All told, energy companies would have a quite strong motivation under CR Rankings to eliminate the practice of mountaintop removal once and for all.
Acid Rain
The Problem
: Air pollution can make rain abnormally acidic, after which the rain then disrupts ecosystems, damages buildings, and affects human health.Fossil fuels like coal and oil contain small amounts of sulfur and nitrogen. Burn those fossil fuels and you then create sulfur dioxide and nitrogen oxide byproducts. Those byproducts can then float up into the atmosphere, combine with water, and form the highly acidic sulfuric and nitric acids. Just a little bit of those two present can be enough to lower the pH (i.e., raise the acidity) of the rain that then comes down.
This acid rain then disrupts ecosystems on the Earth’s surface, especially lakes and rivers. If you’ve ever owned a fish tank, you’ll know that fish are very sensitive to pH levels. (Don’t keep the water’s pH properly balanced and the fish will die.) The same goes for fish out in the wild, of course. With heightened acidity, water absorbs more aluminum and mercury,126 both of which can be toxic to the fish, not to mention the animals or people who then eat the fish.
Forests can also be susceptible to acid rain, as it takes nutrients out of the soil and increases the levels of toxic aluminum. In the 1970s and 80s, for example, fifty percent of canopy red spruces died off or were damaged in the High Peaks of the Adirondack Mountains thanks to the acidic clouds that tend to gather in the area.127 Buildings and cars can also take the brunt of more acidic rain. According to the EPA, many automakers in the US. now use acid-resistant paint to combat the problem, a fix that costs them (and really therefore costs car buyers) $61 million a year.128
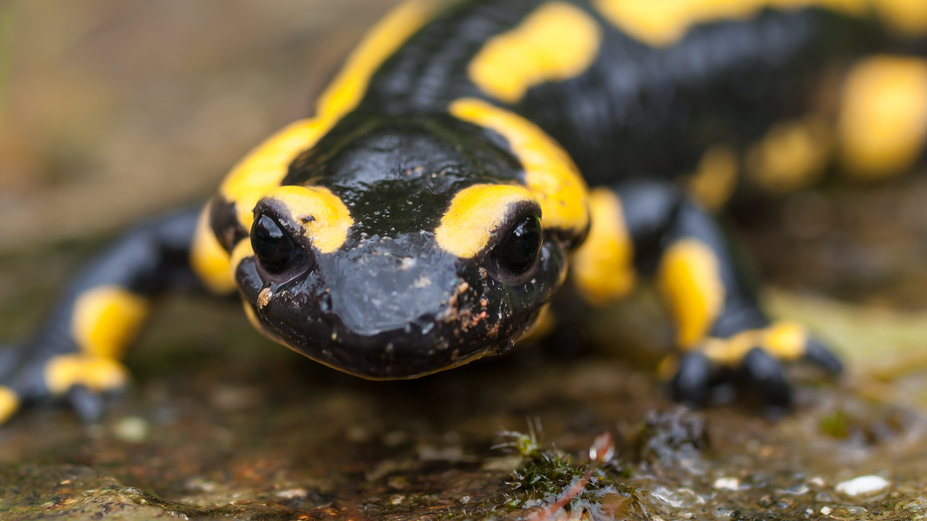
William Warby/Flickr
In 1990, Congress amended the Clean Air Act to include new regulation of SO2 and NOx (called the Acid Rain Program). An analysis of the Acid Rain Program has since determined that as of 2010 the program saves the United States $122 billion annually. That benefit has come largely by reducing the amount of SO2 and NOX in the atmosphere by an estimated 46.2% and 34.2% thanks to the program.129 That’s huge progress so far, but it still means there are many billions of dollars more worth of damage being done to our health each year thanks to these pollutants. As long as people burn fossil fuels, there will inevitably be somewhat prevalent acid rain.
How CRR Would Help
: CR Rankings would strongly discourage companies from burning fossil fuels, which is the primary source of the chemicals that cause acid rain.With the Carbon Footprint metric, CRR would encourage companies to drastically reduce their use of fossil fuels. The less coal and oil we burn, the less sulfur dioxide and nitrogen oxides we will produce. And that means much less acid rain. These chemicals would also be considered pollutants under the Non-Greenhouse Pollution metric, giving corporations an even bigger incentive to reduce their production, even with the remaining fossil fuels being burned. With CR Rankings, we could build on the tremendous progress we’ve made in recent decades and get rid of acid rain altogether.
Companies Abandoning Communities
The Problem
: Companies can now move around the globe more easily than ever. That may be good for business, but shipping jobs overseas devastates the cities and towns left behind.For businesses, the world keeps getting smaller. Shipping halfway around the planet now only takes days. Communicating that far takes seconds. Combine this smaller world with the fact that it’s often cheaper to set up shop in one place versus another, and it’s little surprise that businesses are now splitting up their operations all around the globe. Offices in Los Angeles and London, factories in India and Bolivia, distributors in Little Rock, Shanghai, and Melbourne.

Albemar78/Flickr
But companies aren’t just more spread out. They’re also more often on the move. What’s that? The minimum wage is going up by fifty cents where I have my factory? And this other country just lowered their corporate tax by a hair? Well, let’s move the factory there. But…now the economic winds have slightly shifted again and the cost of business is slightly cheaper somewhere else? Time to move again. Because the world has become so much smaller, such movement of jobs is becoming quite commonplace.
While such easy job movement may be great for businesses, it’s bad for most everyone else. When a factory shutters to head overseas and save a few bucks, it can leave a wake of devastation behind. Hundreds, maybe thousands lose their jobs. There are of course the direct effects of this kind of unemployment—economic hardship, depression, hunger, lack of health care, a higher likelihood of divorce. And then there are the ripple effects on the local community. Those newly unemployed now have no money to spend around town. Other businesses in the area thus lose customers, perhaps even to the point of having to close their doors, too. Tax revenue dries up, causing deficits and all of the related painful cuts in local government service: school cutbacks, police staff reductions, etc.
One need look no further than the American Rust Belt to see how devastating the easy movement of jobs can be. Over the last half century, General Motors has shipped over 70,000 jobs out of its hometown of Flint, Michigan.130 In the process a once-thriving industrial city has decayed into an American tragedy. Forty-one percent of Flint’s residents now live under the poverty line,131 and the sky-high crime rate regularly gives Flint the dubious ranking of most dangerous city in the US.132 Our communities simply can’t adapt as quickly as companies can when they flit around the world.
Meanwhile, job movement can also do plenty of harm to the families who keep the jobs by moving with them. Children who move more often tend to do worse in school and have more behavioral problems.133 They also have more issues years later as adults. Studies show the frequent movers as children go on to later in life have more instances of drug abuse, criminality, psychiatric problems, and suicide attempts,134 all while reporting themselves as having fewer quality relationships, worse well-being, and lower life satisfaction.135 The more employees have to move to follow their jobs, the worse it usually is for their kids.
In a more general way, frequent moving can also easily erode our feeling of community. There are many ways to find a sense of community, sure, but the simplest way is to connect and bond with the people immediately around you. A growing issue in modern society, though, is that we increasingly don’t. A survey in the United Kingdom found that 70% didn’t even know their neighbors’ names, and that only 6% said there was a strong sense of community where they lived.136 Much of the blame surely goes to the internet and other modern technology that lets us avoid direct human contact. Excessive moving doesn’t help, either, though. (Why would you get to know anyone around you if you’re just going to have to move again in a few years?) The average American moves a whopping 11.4 times in a lifetime.137 The more often companies shift their employees about the globe, the harder it is for anyone to get that essential feeling of community.
How CRR Would Help
: With the Job Location Stability metric, businesses would earn higher CR Rankings the less often they move their jobs from one place to another. Our communities could thus grow stronger with more stable employment, economies, and neighborhoods.20% of CRR’s Community Ranking would come from the Job Location Stability metric. Specifically it would rank companies by what percentage of their jobs they have relocated at least twenty miles away in the last five years, the last ten years, and the last fifteen years. No business would have to keep its jobs frozen in one place forever, of course, but this metric would help push companies to invest in certain communities and (at least mostly) stay put there. By doing so, communities and their working citizens could enjoy a renewed stability that has otherwise steadily eroded over time. That’s better for towns that might otherwise fall apart if half the jobs suddenly leave. That’s better for kids who need a more stable upbringing to live a healthier life overall. And that’s better for our neighborhoods to develop a stronger sense of community.
Species Endangerment and Extinction
The Problem
: Human activity is permanently killing off species at a rate almost never seen in the four billion years of life on Earth.
Jack Dykinga/USDA
Some species go extinct naturally, sure. Millions of species have been born and then died off since the beginning of Earth. Right now, though, humans are responsible for the vast majority of extinctions, and our planet is experiencing approximately 100 to 10,000 times the natural extinction rate.138,139 That means for every one species that would naturally go extinct, hundreds if not thousands more are going extinct because of us. Yikes. Humans are, in fact, already the biggest species killer since a massive asteroid struck Earth and killed off the dinosaurs 65 million years ago.140 And with the human population still growing exponentially, there’s no telling how much more destructive we will become.
This begs the question, what is it that we’re doing that’s so harmful to all of these species that are dying off? Here are the main causes of these extinctions:
- Habitat destruction – As humans cut down forests, fill in wetlands, blow up mountains, and generally take over land for our own uses, we eliminate the homes for all kinds of living things in the process. Humans might be good at living in all kinds of places, but most fish, frogs, and flowers aren’t. When we destroy their homes, they die off. Pretty simple.
- Overexploitation – Obviously we often directly kill living things in the wild for our own good, like lobster to eat and trees to build houses. Kill enough of them, though, and we can kill off entire species. Humans have already driven scores of species to extinction this way, notably the wooly mammoth thousands of years back. We’re currently threatening to kill off many more through overexploitation, though, like many species of trees, fish, elephants, and whales.
- Pollution – Just like how so many of the chemicals we humans produce are harmful to us, they’re also harmful to all of the other living things on Earth. Whether it’s synthetic pesticides sprayed on crops or microscopic particles spewed into the air, these chemicals are building up throughout our planet and causing higher rates of cancer and other diseases among all kinds of species (which also leads to higher rates of extinction).
- Global warming – Global warming is the silent but potentially most lethal species killer of all. With higher temperatures and higher CO2 levels, global warming is destroying habitats and raising the acidity of the ocean. In 2007, the International Panel on Climate Change estimated that if average global temperatures increase by over 3.5 °C (an almost certain scenario if we continue on our current warming path) then we stand to lose 40-70% of all known species on Earth.141
Of course, one might wonder why we should care. If plenty of species died off before humans came to the scene, why should we care if more die off now? Well, suffice it to say, the world’s ecosystems are all quite interdependent. When one species disappears, it hurts all the rest. And that includes us. Take the honey bee. It has by no means gone extinct, but it has steadily headed in that direction over the last several decades as its populations have dwindled worldwide. That might seem shrug-worthy, but the bee pollinates all kinds of crops that we depend on—fruits, vegetables, and nuts, not to mention crops like hay and clover that livestock depend on as well. Honeybee shortages have thus led to record prices for almonds and forced the Chinese to start pollinating their apple trees by hand. And all of that stems just from reduced populations of one species, not to mention how awful it would be with outright extinction of one species, much less with the extinction of thousands of species. At best, extinctions cost us a lot of money. At worst, they will bring us humans to the doorstep of extinction as well.
How CRR Would Help
: By fighting most of the main causes of species extinction—habitat destruction, overexploitation, pollution, and global warming—CRR should greatly slow this mass extinction and potentially save many thousands of species.Let’s take a more specific look at how CRR would deal with many of the main causes of species extinction:
- Habitat destruction – CRR would require that corporations report when they build on or in any other way destroy rainforests, wetlands, and other habitats vital to biodiversity. Such actions would then earn companies lower rankings thanks to the Additional Factors metric.
- Overexploitation – All resources that a business takes from the earth would need to be tallied and submitted to the government thanks to CRR. That includes all plants, animals, and any other living species. A company’s rankings would be docked for any species it harvests that are listed as endangered or threatened by the IUCN. The more endangered the species and the greater the numbers taken, the more rankings would be docked.
- Pollution – With the Non-Greenhouse Pollution metric, CR Rankings would lower the rankings of companies that use more toxic chemicals. With the Biodegradability & Recyclability metric, CR Rankings would lower the rankings of companies that produce less biodegradable substances (like plastics). Those two combined would take a huge bite out of the production of substances that harm our world’s ecosystems.
- Global warming – As 40% of the Environment ranking, global warming would weigh heavily on any company’s CR Rankings. The more CRR would push businesses to lower their carbon footprints, the fewer habitats would be destroyed and the less acidified the oceans would become. That would be a huge boost for endangered species around the world.
Accumulation of Plastic in the World’s Oceans
The Problem
: Plastic is building up in our oceans at an alarming rate. Small, non-biodegradable pieces of plastic dehydrate and starve the marine animals that eat them, all while poisoning them with the toxic chemicals the plastic collects.We humans produce a ton of plastic. Errr, more specifically, we produce about 225 million tons of plastic every year.142 Eight million of those tons—after going down storm drains, falling off boats, or blowing away from landfills—make their way into our oceans each year.143 On land, discarded plastic mostly just sits there. In the ocean, though, it wreaks havoc.
The first issue here is that that plastic never really decomposes. Fish poop, dead kelp, and most other waste in our oceans aren’t ever really a problem because they will all be digested by other fish, bacteria, worms, etc, and thus recycled through the system. Plastic will not. Plastics take anywhere from a year to hundreds of years to break down into smaller pieces, depending on the type of plastic. (If Shakespeare had used modern fishing line, it would most likely still be breaking down now.)144,145 Even after all that time, though, essentially no organisms will be able to fully digest and break down those smaller pieces of plastic to the molecular level. Therefore, when we dump plastic in the oceans, those small pieces just stay there and keep building up. According to the World Economic Forum, a Swiss non-profit organization, the world’s oceans currently have one-fifth as much plastic as they have fish, by weight. Should current trends continue, ocean plastic will start outweighing all the fish by 2050.146
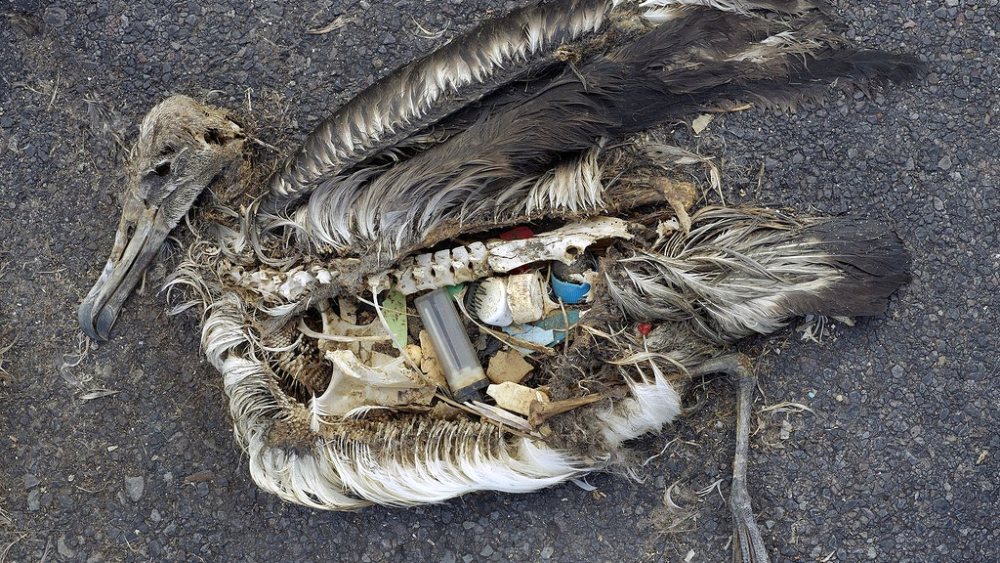
The remains of an albatross chick found in 2009 on Midway Atoll, a tiny Pacific island over 2,000 miles from the nearest continent.
Chris Jordan/US Fish and Wildlife Service
Meanwhile, all that plastic can be incredibly harmful. To begin with, marine birds, mammals, and fish can easily get tangled in plastics or choke on them when trying to eat them. According to a United Nations report, up to one million seabirds are killed every year by ingesting or becoming entangled in plastic debris.147 When plastic decomposes, it also tends to release harmful chemicals built into the plastic (like bisphenol-A, PS oligomer, and vinyl chloride) plus other bonus toxic chemicals that the plastic bits have absorbed while floating in the ocean (like pesticides). Eat plastic, and you take in all of those chemicals. The tangling, choking, and poisoning are already quite potently bad for marine animals, but that’s not all. Eating plastic also starves and dehydrates animals because, when the gut’s full of plastic, that blocks actual food and water from being ingested and properly absorbed into the blood stream. Of the half million albatross chicks that hatch on Midway Island each year, about forty percent now die, most of them from such starvation or dehydration. Some of those deaths are no doubt natural, but a two-year study by the EPA found that the albatross chicks that died there from starvation or dehydration had on average twice as much plastic waste in their stomachs as the chicks that died from other causes.148
If this wasn’t all bad enough for all marine life, remember that everything circles back to us. When fish, birds, and even organisms as small as zooplankton are eating plastic and taking in all of their accumulated chemicals, those chemicals will most definitely work their way into what we’re eating, too. Poison the oceans and we poison ourselves.
How CRR Would Help
: Within the Environment ranking, businesses would be rewarded for using more environmentally friendly plastics, less plastic overall, and fewer toxic chemicals. That would mean fewer non-biodegradable plastic bits floating in our oceans, and those that remain would be less toxic. In other words, CRR would lead to far cleaner and healthier oceans.With the Biodegradability & Recyclability metric, CRR would encourage companies to use substances that more easily biodegrade and/or recycle. With the Non-Greenhouse Pollution metric, CRR would also encourage companies to use fewer toxic chemicals. Plastics, of course, generally don’t biodegrade well, can only be recycled once, and contain plenty of toxic chemicals. CR Rankings would thus motivate businesses to start using less and less plastic and/or to invent less toxic plastics that biodegrade and recycle more easily. Over time, that should mean much less plastic winding up in our oceans, and less harmful plastic at that.
On top of all of that, remember that the Non-Greenhouse Pollution metric should also encourage companies to use plenty other fewer toxic chemicals (like pesticides and industrial solvents), the kinds that wind up floating around in the ocean, being absorbed by floating bits of plastic, and then released in the unfortunate animal that eats that plastic. So overall, with CRR we should see less plastic winding up in our oceans, and fewer bad chemicals held inside of that plastic.
Landfills
The Problem
: Landfills are a significant contributor to climate change and can leak toxic chemicals that harm residents nearby.About 25% of global warming stems from methane emissions.149 While we create far more carbon dioxide than methane, methane is far more potent at trapping heat in the atmosphere, over twenty-five times more so than CO2.150 Landfills, meanwhile, are essentially giant methane factories. All that food and paper you throw away is inevitably going to get eaten and broken down somewhere, mostly by bacteria. When that happens inside massive mounds of trash, though, there’s almost no oxygen present. We’ll skip the elaborate biology lesson, but break that food down with oxygen present and you’ll make carbon dioxide. Do it without O2 and you’ll get methane. Lots of it. As such, about 6% of global methane emissions come from landfills,151 meaning landfill-produced methane currently accounts for roughly 1.5% of Earth’s warming each year.152 Here in the US that figure is about three times higher thanks to our world-leading production of trash.153
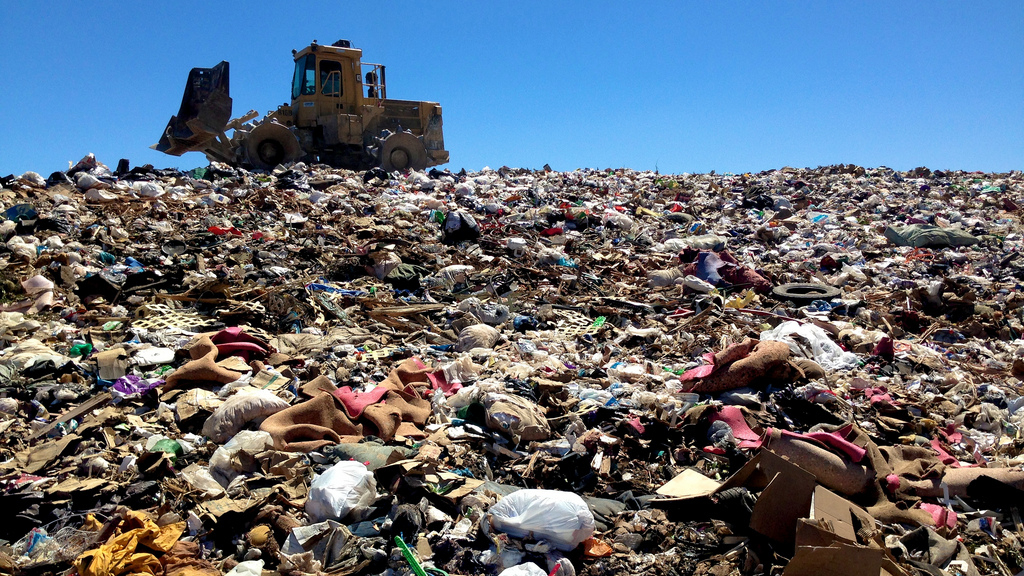
Adam Levine/Flickr
Landfills are also a great way to create a brew of toxic chemicals. Dump thousands of consumer-owned electronic devices, batteries, light bulbs, and buckets of paint together in one place, add rainwater, and let the chemicals leach out over time. What you get is called leachate. It’s similar to the garbage juice that might accumulate at the bottom of your trash bag, but leachate is generally full of lead, cadmium, mercury, ammonia, methane, and many other harmful, often carcinogenic chemicals. Should the protective liners underneath the landfill spring leaks—as the EPA has stated will inevitably happen with any liner, no matter how well made154—these chemicals will then get out into the groundwater. They can also float out by air. However this toxic chemical migration happens, exactly, it can affect the health of the residents who live nearby, even long after a landfill closes. Studies have shown that women living near landfills, for example, have an over four-fold higher risk of bladder cancer and leukemia,155 as well as more frequent birth defects in their children.156
Another great way to project those harmful chemicals out into surrounding communities is with landfill fires. Such fires aren’t too common, but when they start they can spread easily given all of the widespread (and highly flammable) methane. While burning, they release all those chemicals from before into the air while creating dangerous new ones as part of the combustion process (including carbon monoxide, hydrogen sulfide, sulfur dioxide, and benzene).157 One recent fire at a St. Louis landfill, one that has been steadily burning there for years since December 2010, also happens to be burning about a thousand feet away from 9,000 tons of nuclear waste.158 If the fire were to migrate over to the nuclear waste—the subject of intense media questioning of late—it would likely, at the least, begin emitting radon and other radioactive particles into the atmosphere. Worse, it could explode.159
Overall, landfills add to global warming and worsen our health. As the world continues to consume more and more stuff, stuff that is often toxic and usually not so biodegradable, our landfill woes are on track to only get worse.
How CRR Would Help
: By encouraging the production of less waste with fewer toxic chemicals, CR Rankings would reduce the toxicity and warming effects of landfills.First, in terms of the toxic chemicals in landfills, the Non-Greenhouse Pollution metric would push businesses to use fewer hazardous chemicals in their products. The fewer toxic chemicals being made, the fewer that can wind up in landfills, making the waste that is there less harmful to the people nearby. Pretty simple.
Second, a variety of metrics would help reduce the greenhouse effects of landfill methane. The Carbon Footprint metric would help promote creating less waste, since the, say, excess packaging material we so often see used takes a lot of fossil fuels to make. Keeping that waste out of the landfill would mean less paper material for methane-producing bacteria to eat and less other stuff there to block out oxygen from the piles of trash. The Charitable Giving metric would motivate any companies with extra food on their hands to donate it instead of throwing away as trash. That would as well bring down the amount of stuff for that landfill bacteria to eat, also bringing down the methane produced. The Biodegradability & Recyclability metric would encourage companies to make sure the products, packaging material, and other waste that they create would be either recyclable or easily biodegradable. With more recyclable waste, consumers would send less to landfills. By making the rest more easily biodegradable, more could be separately composted, again reducing the pile that goes to the dump. And the waste that does end up in the landfill would still break down more quickly, at least. The Biodegradability & Recyclability metric also gives companies credit for directly recycling its own waste products, instead of trashing them, again reducing the amount of stuff sent to the landfill. Put together, all of those metrics should consistently slow the growth of our landfills and reduce their toxicity.
Workplace Injuries, Illnesses, and Deaths
The Problem
: Every year, millions get sick or die because of their jobs.
Ryan Conroy/US Air Force
An estimated 2.3 million people die every year around the world because of their jobs.160 To put it in gruesome terms, that’s equivalent to multiple 9/11s every day. These deaths primarily stem from diseases, cancers, and injuries thanks to unsafe work environments (e.g., from hazardous substances, improper safety procedures, lack of safety equipment). And then there are the many, many millions more non-fatal injuries and illnesses that still impair a wide swath of the population for months, years, or even entire lives. If you’re numb to the human toll, maybe you’ll at least care about the money we’re throwing away on such workplace injuries and deaths—an estimated average of 4% of GDP per country,161 a.k.a. somewhere north of $3 trillion worldwide each year.162,163 The most tragic part is that many if not most of these illnesses, injuries, and deaths are rather preventable.
How CRR Would Help
: With the Worker Safety & Health metric, all companies would be ranked by their number of workplace-related illnesses, injuries, and deaths. Businesses would thus be motivated to make their workspaces as safe as possible, and that could mean many millions fewer sicknesses, accidents, and deaths every year.The Worker Safety & Health metric would, first, rank all businesses by the work-related injuries, illnesses, and deaths of their employees. The more harm done per one hundred employees, the lower the ranking. Second, companies would be ranked by how well their employees feel their safety and health are protected. Put together, the WS&H metric would strongly encourage businesses to take whatever steps they could to make the workplace safer—to reduce the use of harmful chemicals, give better access to health care, give better safety equipment, etc. This pressure on companies should over time bring a steady reduction to the overall number of workplace illnesses, injuries, and deaths, a great boon to our health but also to our overall health care bill.
Secondly, the Non-Greenhouse Pollution metric would rank all corporations by how many harmful chemicals they pump out into the world. As businesses use fewer such chemicals in their products and manufacturing processes, CRR would reduce workplace exposure to those chemicals. That would then reduce illnesses and deaths caused from such chemicals. Put together, the Worker Safety & Health and Non-Greenhouse Pollution metrics should go a long ways towards reducing workplace injuries, illnesses, and deaths.
Exploitation of Unpaid “Internships”
The Problem
: Many (if not most) unpaid internships are less about educating and more about exploiting free labor. This financially hurts the young worker and expands the pay gap between the rich and the poor.In theory, an unpaid internship can be a great thing. The young intern gets invaluable experience and a foot in the door of the industry. In practice, though, unpaid internships—which are supposed to exist solely for the educational benefit of the intern—easily become more about getting grunt work done at no cost. Why pay out minimum wage when you can call that entry-level job an “internship” and pay nothing? The last few years have seen a slew of lawsuits from former interns who say they received no education and really just worked for free.

Reynermedia/Flickr
The obvious problem here is these workers are being exploited. Unpaid internships have other bad ripple effects, too, though. For starters, these jobs can shift the whole pay scale down. If your entry-level workers are now paid nothing, the next level up can now be paid the low amount you would have otherwise paid the rookies, and so on and so on. Get it? It saves the company a ton of money, sure, but it also exacerbates income inequality.
Unpaid internships also favor the children of the wealthy, whose families can help them pay the bills while they’re making nothing. Lower-class students and recent graduates usually can’t afford to work for free, so they miss out on those job opportunities. These internships therefore contribute even more to greater income inequality and lower social mobility.
How CRR Would Help
: By default, internships would factor into the Workers pay metrics the same as any other jobs. Low or no pay for “interns” would mean lower Workers rankings. CR Rankings would thus push businesses to either pay their interns a decent wage or prove that they are true internships—purely educational and not designed to help the company.Interns would by default count as normal employees under CR Rankings. That means when tabulating the Distribution of Wealth and Pay Relative to Local Standard of Living metrics, the $0 given to any unpaid intern would hurt the company’s Worker rankings accordingly. (The same would go for any intern paid, but paid poorly, as well.)
Businesses could, of course, deal with this in one of two ways. One is to admit that many of these internships are a sham and to start financially treating the “interns” like they’ve already been treating them in the workplace: as normal employees. The second is to actually prove that the internship abides by the Department of Labor’s six requirements for an unpaid internship:
“1.) The internship, even though it includes actual operation of the facilities of the employer, is similar to training which would be given in an educational environment; 2.) The internship experience is for the benefit of the intern; 3.) The intern does not displace regular employees, but works under close supervision of existing staff; 4.) The employer that provides the training derives no immediate advantage from the activities of the intern, and on occasion its operations may actually be impeded; 5.) The intern is not necessarily entitled to a job at the conclusion of the internship; and 6.) The employer and the intern understand that the intern is not entitled to wages for the time spent in the internship.”
Should the company give proof that those six requirements are consistently being met with all applicable internships, those positions would then not be counted under the Worker metrics. This would enable any company that abides by the true spirit of the internship (i.e., an educational program there for the benefit of the young worker) to not be punished on its behalf.
Toxic Chemical Ingestion
The Problem
: In the modern world, harmful manmade chemicals are all around us. Unsurprisingly, we thus eat, drink, and breathe them in throughout our lives, leading to higher rates of cancer, birth defects, autism, and many other health problems.The tricky backlash of many of the synthetic chemicals that we create is that they don’t tend to break down very well in nature. Thus, the more of them we produce, the more they build up in the air, water, and soil around us and, inevitably, in our bodies as well from breathing, drinking, and eating them. Take a bite of your breakfast and you’re also eating organophosphate pesticides from the grains and milk. Take a swig of bottled water and in go phthalates and bisphenol A that have leached out from the plastic. Take a breath in your living room and you’ve now consumed polybrominated diphenyl ethers from your TV and toxic flame retardants from your carpet.164 Then there are the chemicals in our cleaning products, soaps, toys, makeup… According to the Harvard T.H. Chan School of Public Health, there are over 10,000 chemicals in our everyday products that have not been approved by the FDA.165
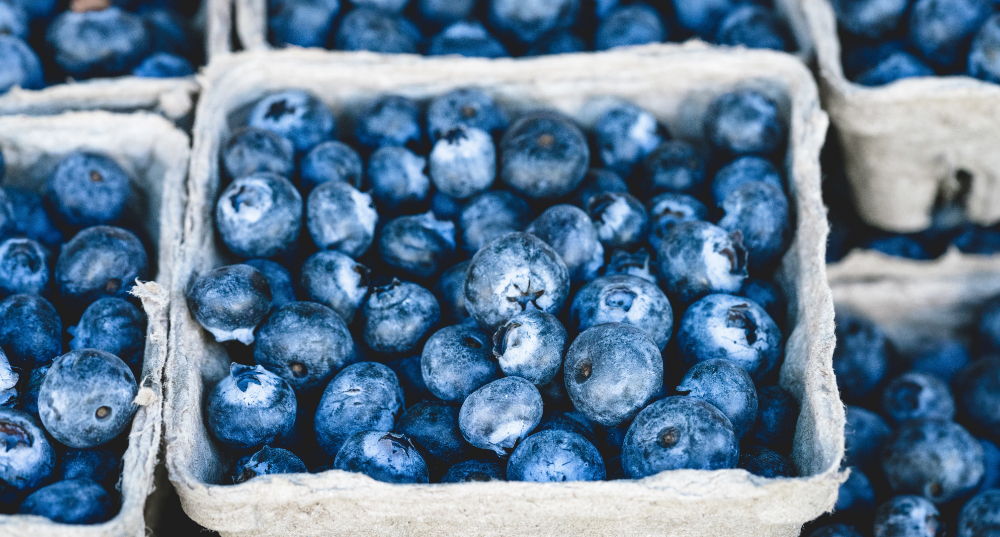
Veterezy/Unsplash
And it isn’t just inside of the home. Try to walk outside to escape such chemicals and now you’re all the more exposed to air pollutants from our power plants, cars, and factories. The chemicals we produce are now found quite literally everywhere that we living things can go on Earth. Scientists recently tested crustaceans living in the Mariana Trench, the deepest point in any of our oceans (i.e., about as far as a living thing can be from human civilization), and still found “extremely high levels” of numerous toxic manmade chemicals “in all samples across all species at all depths.”166
Now you may be thinking, what’s the big deal? I don’t get sick from this stuff, right? I feel perfectly fine. Well, the thing is that manmade chemicals and their byproducts generally don’t affect you like, say, a cold virus would. There you see an immediate, quite unpleasant, and sneezy result. However, low-level everyday consumption of chemicals adds up over time and can then lead to much worse health problems. Quite a few such chemicals raise your risk of cancer.167 Studies have also linked chemicals like phthalates, pesticides, PM2.5s, BPA, and benzene to higher rates of decreased lung function,168 aplastic anemia,169 chronic bronchitis,170 birth defects,171 fetal death,172 increased blood pressure,173 ADHD,174 Parkinson’s disease,175 suicide,176 lower IQ,177 autism,178 and premature death179 (just to name a few). In other words, you may not see the harmful chemicals that you consume each day nor knowingly feel their effects, but it’s quite likely that they will contribute to one or more major health problems in your life and perhaps hasten your death.
How CRR Would Help
: The Non-Greenhouse Pollution metric would lower the CR Rankings of any company that uses chemicals that are known to harm our health. Over time that should steadily decrease the production of toxic chemicals, as well as the vast array of health disorders caused by them.When it comes to low-level everyday toxic chemical ingestion, it’s hard to pinpoint the exact level of danger we face from each individual toxin. What is pretty clear, though, is that less exposure is better. By including all such harmful chemicals in the Non-Greenhouse Pollution metric, CRR would push companies to produce less and less of them. And the fewer harmful chemicals that companies produce, the fewer that wind up inside of us. That’s a big win for our health and for the environment. It’s also, though, a big win for our wallets, too. A recent study put the cost of such everyday toxic chemical exposure here in the US at a staggering $340 billion in health costs and lost wages each year.180 (That’s over a thousand dollars per person every year!) Without all of those harmful chemicals we’ll be all the healthier and richer to boot. Quite the win-win.
Endnotes
1 20 Facts About U.S. Inequality That Everyone Should Know. Stanford Center on Poverty & Inequality, 2011, inequality.stanford.edu/publications/20-facts-about-us-inequality-everyone-should-know.
2 Chamberlain, Andrew. CEO to Worker Pay Ratios: Average CEO Earns 204 Times Median Worker Pay. Glassdoor Economic Research, 25 Aug. 2015, www.glassdoor.com/research/ceo-pay-ratio/.
3 Milanovic, Branko. “Global Inequality and the Global Inequality Extraction Ratio.” The World Bank Development Research Group Poverty and Inequality Team, Sept. 2009, documents.worldbank.org/curated/en/389721468330911675/pdf/WPS5044.pdf.
4 Mullany, Gerry. World's 8 Richest Have as Much Wealth as Bottom Half, Oxfam Says. The New York Times, 16 Jan. 2017, www.nytimes.com/2017/01/16/world/eight-richest-wealth-oxfam.html.
5 United Nations Development Programme. "Sustaining Human Progress: Reducing Vulnerabilities and Building Resilience." Human Development Report, 2014, p. 19, www.compassion.com/multimedia/human-development-report-2014-undp.pdf.
6 “State of Food Insecurity in the World 2015 in brief.” Food and Agriculture Organization of the United Nations, 2015, p. 2, www.fao.org/3/a-i4671e.pdf.
7 Gabler, Neal. “The Secret Shame of Middle-Class Americans.” The Atlantic, Atlantic Media Company, May 2016, www.theatlantic.com/magazine/archive/2016/05/my-secret-shame/476415/.
8 Levaux, Janet. “83% Of Americans Say They Can't Afford College: Edward Jones Poll.”ThinkAdvisor, 13 May 2015, www.thinkadvisor.com/2015/05/13/83-of-americans-say-they-cant-afford-college-edwar.
9 Abbey-Lambertz, Kate. Here's How Much Income You Need To Afford Rent In Every State. The Huffington Post, 28 May 2016, www.huffingtonpost.com/entry/how-much-income-you-need-to-afford-rent-by-state_us_574880cae4b0dacf7ad4c828.
10 Payne, Keith. Broken Ladder: How Inequality Affects the Way We Think, Live, and Die. Penguin Random House, 2017, p. 205.
11 Payne, Broken Ladder. P. 120.
12 Payne, Broken Ladder. P. 118.
13 Payne, Broken Ladder. P. 174.
14 Payne, Broken Ladder. P. 111.
15 Malinen, Tuomas. The Economic Consequences of Income Inequality. The Huffington Post, 17 Dec. 2015, www.huffingtonpost.com/tuomas-malinen/the-economic-consequences_b_8827634.html.
16 Atems, Bebonchu, and Jason Jones. “Income Inequality and Economic Growth: a Panel VAR Approach.” SpringerLink, Springer Berlin Heidelberg, 23 July 2014, link.springer.com/article/10.1007%2Fs00181-014-0841-7.
17 Malinen. Economic Consequences.
18 “Climate Change 2014: Synthesis Report.” Intergovernmental Panel on Climate Change, 2015, www.ipcc.ch/pdf/assessment-report/ar5/syr/SYR_AR5_FINAL_full_wcover.pdf.
19 Shelanski, Howard, and Maurice Obstfeld. “Estimating the Benefits from Carbon Dioxide Emissions Reductions.” The White House, The United States Government, 2 July 2015, obamawhitehouse.archives.gov/blog/2015/07/02/estimating-benefits-carbon-dioxide-emissions-reductions.
20 Than, Ker. “Estimated Social Cost of Climate Change Not Accurate, Stanford Scientists Say.” Stanford News, Stanford University, 12 Jan. 2015, news.stanford.edu/2015/01/12/emissions-social-costs-011215/.
21 Total Greenhouse Gas Emissions (Kt of CO2 Equivalent). The World Bank, data.worldbank.org/indicator/EN.ATM.GHGT.KT.CE.
22 We multiplied the estimated social costs of $36 and $220 per CDE ton (from the White House14 and from Stanford scientists20, respectively) by the 53.5 billion tons of CDE created in 201221 to get an estimated cost of global warming to be $1.9 to $11.8 trillion dollars in 2012.
23 See endnotes 65 and 66 from Part II: Our Current Approach Is Doomed to Fail.
24 International Decade for Action 'WATER FOR LIFE' 2005-2015. United Nations, www.un.org/waterforlifedecade/scarcity.shtml.
25 Postel, Sandra. A Sacred Reunion: The Colorado River Returns to the Sea. National Geographic, 18 May 2014, voices.nationalgeographic.org/2014/05/19/a-sacred-reunion-the-colorado-river-returns-to-the-sea/.
26 Evans, Cathy. Groundwater Level Decline Continues Across Western and Central Kansas. Kansas Geological Survey, 7 Feb. 2012, www.kgs.ku.edu/General/News/2012/2012groundwaterlevels.html.
27 Plumer, Brad. “How Long before the Great Plains Runs out of Water?” The Washington Post, WP Company, 12 Sept. 2013, www.washingtonpost.com/news/wonk/wp/2013/09/12/how-long-before-the-midwest-runs-out-of-water/.
28 WHO World Water Day Report. World Health Organization, www.who.int/water_sanitation_health/takingcharge.html.
29 “Water Uses.” AQUASTAT - FAO's Information System on Water and Agriculture, Food and Agriculture Organization of the United Nations, 2016, www.fao.org/nr/water/aquastat/water_use/index.stm.
30 Wenzlau, Sophie. To Combat Scarcity, Increase Water-Use Efficiency in Agriculture. Worldwatch Institute, 1 Mar. 2013, www.worldwatch.org/combat-scarcity-increase-water-use-efficiency-agriculture-0.
31 McDermott, Mat. From Lettuce to Beef, What's the Water Footprint of Your Food? Tree Hugger, 11 June 2009, www.treehugger.com/green-food/from-lettuce-to-beef-whats-the-water-footprint-of-your-food.html.
32 Gravelle, Jane G. “Tax Havens: International Tax Avoidance and Evasion.” Congressional Research Service, 15 Jan. 2015, www.fas.org/sgp/crs/misc/R40623.pdf.
33 McIntyre, Robert S., et al. “The Sorry State of Corporate Taxes: What Fortune 500 Firms Pay (or Don’t Pay) in the USA And What They Pay Abroad – 2008 to 2012.” Citizens for Tax Justice, Feb. 2014, http://www.policymattersohio.org/wp-content/uploads/2014/02/TheSorryStateofCorporateTaxes-Final.pdf.
34 Pomerleau, Kyle. Corporate Income Tax Rates around the World, 2015. Tax Foundation, 1 Oct. 2015, taxfoundation.org/corporate-income-tax-rates-around-world-2015.
35 Vagianos, Alanna. “1 In 3 Women Has Been Sexually Harassed At Work, According To Survey.” The Huffington Post, 19 Feb. 2015, www.huffingtonpost.com/2015/02/19/1-in-3-women-sexually-harassed-work-cosmopolitan_n_6713814.html.
36 Fredericks, Bob. “60 Percent of Women Have Been Sexually Harassed: Poll.” New York Post, 21 Nov. 2017, nypost.com/2017/11/21/60-percent-of-women-have-been-sexually-harassed-poll/.
37 Golshan, Tara. “Study Finds 75 Percent of Workplace Harassment Victims Experienced Retaliation When They Spoke Up.” Vox, 15 Oct. 2017, www.vox.com/identities/2017/10/15/16438750/weinstein-sexual-harassment-facts.
38 Ibid.
39 “Workplace Violence.” OSHA, United States Department of Labor, 14 Feb. 2002, www.osha.gov/archive/oshinfo/priorities/violence.html.
40 “Workplace Violence.” Occupational Safety and Health Administration, United States Department of Labor, www.osha.gov/SLTC/workplaceviolence/.
41 Lipinski, Brian, et al. Reducing Food Loss and Waste. World Resources Institute, June 2013, www.wri.org/publication/reducing-food-loss-and-waste.
42 Gunders, Dana. Wasted: How America is Losing Up to 40 Percent of its Food from Farm to Fork to Landfill. National Resources Defense Council, 2012, www.nrdc.org/food/files/wasted-food-ip.pdf.
43 Hunger and Poverty Facts. Feeding America, www.feedingamerica.org/hunger-in-america/impact-of-hunger/hunger-and-poverty/hunger-and-poverty-fact-sheet.html. Accessed 5 Sept. 2017.
44 “World Hunger, Poverty Facts, Statistics 2016.” World Hunger News, 2016, www.worldhunger.org/2015-world-hunger-and-poverty-facts-and-statistics/.
45 “Food Waste.” Last Week Tonight with John Oliver, season 2, episode 21, HBO, 19 July 2015.
46 Aubrey, Allison. “Why Does Almost Half of America's Food Go to Waste?” PBS Newshour, Public Broadcasting Service, 16 June 2015, www.pbs.org/newshour/bb/almost-half-americas-food-go-waste/.
47 Vidal, John. “We Are Destroying Rainforests so Quickly They May Be Gone in 100 Years.” The Guardian, Guardian News and Media, 23 Jan. 2017, www.theguardian.com/global-development-professionals-network/2017/jan/23/destroying-rainforests-quickly-gone-100-years-deforestation.
48 “Measuring the Daily Destruction of the World's Rainforests.” Scientific American, Nature America Inc, www.scientificamerican.com/article/earth-talks-daily-destruction/.
49 Ibid.
50 Ibid.
51 “Summary of Receipts, Outlays, and Surpluses or Deficits (-) as Percentages of GDP: 1930–2022.” The White House, The United States Government, www.whitehouse.gov/sites/whitehouse.gov/files/omb/budget/fy2018/hist01z2.xls.
52 Budget. Congressional Budget Office, June 2017, www.cbo.gov/topics/budget. Accessed 14 Aug. 2017.
53 “United States National Debt Clock.” National Debt Clocks, www.nationaldebtclocks.org/debtclock/unitedstates. Accessed 14 Aug. 2017.
54 DeSilver, Drew. “What Does the Federal Government Spend Your Tax Dollars on? Social Insurance Programs, Mostly.” Pew Research Center, 4 Apr. 2017, www.pewresearch.org/fact-tank/2017/04/04/what-does-the-federal-government-spend-your-tax-dollars-on-social-insurance-programs-mostly/.
55 Ibid.
56 Gravelle. Tax Havens.
57 Truffer, Christopher J. et al. 2015 Actuarial Report on the Financial Outlook for Medicaid. United States Department of Health & Human Services, 2015, p. ii, www.medicaid.gov/medicaid/financing-and-reimbursement/downloads/medicaid-actuarial-report-2015.pdf.
58 “Federal and State Share of CHIP Spending, FY 2014 (millions).” Georgetown University Health Policy Institute, 2 Dec. 2015, ccf.georgetown.edu/wp-content/uploads/2015/12/Federal-and-State-Share-of-CHIP-Spending.pdf.
59 “Participation and Costs, 1969-2016.” Supplemental Nutrition Assistance Program (SNAP), United States Department of Agriculture: Food and Nutrition Service, 4 Aug. 2017, www.fns.usda.gov/pd/supplemental-nutrition-assistance-program-snap.
60 EITC Awareness Day: Many Workers May Not Know of Significant IRS Benefit. Internal Revenue Service, 30 Jan. 2015, www.irs.gov/newsroom/eitc-awareness-day-many-workers-may-not-know-of-significant-irs-benefit.
61 “A.1.: Federal TANF and State MOE Expenditures Summary by ACF-196 Spending Category, FY 2014.” FY 2014 Overview Tables, US Department of Health & Human Services, www.acf.hhs.gov/sites/default/files/ofa/tanf_financial_data_fy_2014.pdf. Accessed 4 Sept. 2017.
62 With total 2014 US federal and state spending of $496.3 billion on Medicaid,57 $12.8 billion on CHIP,58 $74.1 billion on SNAP,59 $66 billion on EITC,60 and $31.9 billion on TANF,61 these costs combine for $681.1 billion in total spending for the five programs that year.
63 Jacobs, Ken, et al. “The High Public Cost of Low Wages.” Center for Labor Research and Education, UC Berkeley, 13 Apr. 2015, laborcenter.berkeley.edu/the-high-public-cost-of-low-wages/.
64 “10 Facts on Malaria.” World Health Organization, World Health Organization, Dec. 2016, www.who.int/features/factfiles/malaria/en/.
65 Singh, Ajai R., and Shakuntala A. Singh. “Diseases of Poverty and Lifestyle, Well-Being and Human Development.” Mens Sana Monographs, Medknow Publications, 2008, www.ncbi.nlm.nih.gov/pmc/articles/PMC3190550/.
66 Stephens, Philip. “Diseases of poverty and the 10/90 gap.” International Policy Network, Nov. 2004, p. 4, who.int/intellectualproperty/submissions/InternationalPolicyNetwork.pdf.
67 Diarrhoeal Disease. World Health Organization, May 2017, www.who.int/mediacentre/factsheets/fs330/en/.
68 “Household Air Pollution and Health.” World Health Organization, World Health Organization, Feb. 2016, www.who.int/mediacentre/factsheets/fs292/en/.
69 Trouiller, et al. “Drug development for neglected diseases: a deficient market and a public-health policy failure.” The Lancet, vol 359, June 22 2002.
70 McNeil, Donald. New Ebola Vaccine Gives 100 Percent Protection. The New York Times, 22 Dec. 2016, www.nytimes.com/2016/12/22/health/ebola-vaccine.html.
71 Stephens. “Diseases of poverty.”
72 Polinski, J M, and A S Kesselheim. “Where Cost, Medical Necessity, and Morality Meet: Should US Government Insurance Programs Pay for Erectile Dysfunction Drugs?”Clinical Pharmacology and Therapeutics, US National Library of Medicine, Jan. 2011, www.ncbi.nlm.nih.gov/pubmed/21170064.
73 O’Brien, Sara Ashley. “78 Cents on the Dollar: The Facts about the Gender Wage Gap.”CNNMoney, Cable News Network, 14 Apr. 2015, money.cnn.com/2015/04/13/news/economy/equal-pay-day-2015/.
74 Goldin, Claudia. “How to Achieve Gender Equality.” Milken Institute Review Q3: 24-33, 2015, scholar.harvard.edu/files/goldin/files/gender_equality.pdf.
75 Patten, Eileen. “Racial, Gender Wage Gaps Persist in U.S. despite Some Progress.” Pew Research Center, 1 July 2016, www.pewresearch.org/fact-tank/2016/07/01/racial-gender-wage-gaps-persist-in-u-s-despite-some-progress/.
76 Ibid.
77 Ibid.
78 Alonso-Zaldivar, Ricardo. “$10,345 Per Person: U.S. Health Care Spending Reaches New Peak.” PBS, Public Broadcasting Service, 13 July 2016, www.pbs.org/newshour/rundown/new-peak-us-health-care-spending-10345-per-person/.
79 Measuring the Health-Related Sustainable Development Goals in 188 Countries: a Baseline Analysis from the Global Burden of Disease Study 2015. The Lancet, 21 Sept. 2016, www.thelancet.com/journals/lancet/article/PIIS0140-6736(16)31467-2/fulltext.
80 “List of Countries by Total Health Expenditure per Capita.” Wikipedia, Wikimedia Foundation, 7 Aug. 2017, en.wikipedia.org/wiki/List_of_countries_by_total_health_expenditure_per_capita. Accessed 14 Aug. 2017.
82 Attina, Theresa M., et al. Exposure to Endocrine-Disrupting Chemicals in the USA: a Population-Based Disease Burden and Cost Analysis. The Lancet, 17 Oct. 2016, www.thelancet.com/journals/landia/article/PIIS2213-8587(16)30275-3/abstract.
83 Alexander Fleming. New World Encyclopedia, www.newworldencyclopedia.org/entry/Alexander_Fleming. Accessed 1 Sept. 2017.
84 “Antimicrobial Resistance.” World Health Organization, Sept. 2016, www.who.int/mediacentre/factsheets/fs194/en/.
85 McKenna, Maryn. “The Coming Cost of Superbugs: 10 Million Deaths Per Year.” Wired, Conde Nast, 15 Dec. 2014, www.wired.com/2014/12/oneill-rpt-amr/.
86 Taylor, Jirka, et al. The Global Economic Costs of Antimicrobial Resistance. RAND Corporation, 20 May 2016, www.rand.org/blog/2016/05/the-global-economic-costs-of-amr.html.
87 Belluz, Julia. A Woman Died from a Superbug That Outsmarted All 26 US Antibiotics. Vox, 13 Jan. 2017, www.vox.com/science-and-health/2017/1/13/14265620/woman-died-superbug-antibiotics.
88 McKenna, Maryn. “Update: Farm Animals Get 80 Percent of Antibiotics Sold in U.S.” Wired, Conde Nast, 24 Dec. 2010, www.wired.com/2010/12/news-update-farm-animals-get-80-of-antibiotics-sold-in-us/.
89 Dixon, Darius, et al. “The $38 Billion Nuclear Waste Fiasco.” POLITICO, 30 Nov. 2013, www.politico.com/story/2013/11/nuclear-waste-fiasco-100450.
90 “Making progress against child labour.” International Labour Organization, 2013, www.ilo.org/wcmsp5/groups/public/@ed_norm/@ipec/documents/publication/wcms_221513.pdf.
91 Cancer. World Health Organization, Feb. 2017, www.who.int/mediacentre/factsheets/fs297/en/.
92 Elkins, Chris. How Much Cancer Costs. Drugwatch, 7 Oct. 2015, www.drugwatch.com/2015/10/07/cost-of-cancer/.
93 We Quit Tobacco, Here's What Happened Next. CVS Health, cvshealth.com/thought-leadership/cvs-health-research-institute/we-quit-tobacco-heres-what-happened-next. Accessed 1 Sept. 2017.
94 Occupational Cancer. Centers for Disease Control and Prevention, 3 Nov. 2015, www.cdc.gov/niosh/topics/cancer/. Accessed 1 Sept. 2017.
95 Smoking & Tobacco Use. Centers for Disease Control and Prevention, 3 Feb. 2017, www.cdc.gov/tobacco/disparities/low-ses/index.htm. Accessed 5 Sept. 2017.
96 “Giving Statistics.” Charity Navigator, www.charitynavigator.org/index.cfm/bay/content.view/cpid/42. Accessed 6 Dec. 2016.
97 Sparshott, Jeffrey, and Eric Morath. “Corporate Profits in 2015 – The Numbers.” The Wall Street Journal, Dow Jones & Company, 25 Mar. 2016, blogs.wsj.com/briefly/2016/03/25/corporate-profits-in-2015-the-numbers/.
98 Dividing the total US corporate donations in 2015 of $18.45 billion158 by the total corporate (pre-tax) profits 2015 of $1.89 trillion159 (and then multiplying by 100) yields 0.98% given to charity.
99 Carrington, Damian. “More People Die from Air Pollution than Malaria and HIV/Aids, New Study Shows.” The Guardian, Guardian News and Media, 16 Sept. 2015, www.theguardian.com/environment/2015/sep/16/more-people-die-from-air-pollution-than-malaria-and-hivaids-new-study-shows.
100 Ibid.
101 The article cites farms as accounting for one fifth of global deaths from outdoor air pollution (20%), one seventh from power plants (14.3%), and 5% from traffic.100 Those three combine to about 39.3%.
102 Perlman, David. “Scientists Alarmed by Ocean Dead-Zone Growth.” SFGate, 15 Aug. 2008, www.sfgate.com/green/article/Scientists-alarmed-by-ocean-dead-zone-growth-3200041.php.
103 Ibid.
104 Aquatic Dead Zones: Image of the Day. NASA, 1 Jan. 2008, earthobservatory.nasa.gov/IOTD/view.php?id=44677.
105 Dodds, Walter K., et al. “Eutrophication of U.S. Freshwaters: Analysis of Potential Economic Damages.” Environmental Science & Technology, American Chemical Society, 3 Oct. 2008, pubs.acs.org/doi/pdf/10.1021/es801217q.
106 “Global Meat Production and Consumption Continue to Rise.” Worldwatch Institute, www.worldwatch.org/global-meat-production-and-consumption-continue-rise. Accessed 14 Aug. 2017.
107 “Fish to 2030: Prospects for Fisheries and Aquaculture.” The World Bank, Dec. 2013, p. xiii, www.fao.org/docrep/019/i3640e/i3640e.pdf.
108 The increase in global aquaculture production from 5 to 63 million tons per year96 equates to a 1160% increase.
109 “What Is Ocean Acidification?” PMEL Carbon Program, NOAA, www.pmel.noaa.gov/co2/story/What+is+Ocean+Acidification%3F.
110 Ibid.
111 Chu, Jennifer. “Ocean Acidification May Cause Dramatic Changes to Phytoplankton.” MIT News, Massachusetts Institute of Technology, 20 July 2015, news.mit.edu/2015/ocean-acidification-phytoplankton-0720.
112 De'atha, Glenn, et al. “The 27–Year Decline of Coral Cover on the Great Barrier Reef and Its Causes.” Proceedings of the National Academy of Sciences, National Acad Sciences, 5 Sept. 2012, www.pnas.org/content/109/44/17995.abstract.
113 Tollefson, Jeff. “Landmark Experiment Confirms Ocean Acidification's Toll on Great Barrier Reef.” Nature.com, Macmillan Publishers Limited, 24 Feb. 2016, www.nature.com/news/landmark-experiment-confirms-ocean-acidification-s-toll-on-great-barrier-reef-1.19410.
114 Huizen, Jennifer. Oceans Could Lose $1 Trillion in Value Due to Acidification. Scientific American, 21 Oct. 2014, www.scientificamerican.com/article/oceans-could-lose-1-trillion-in-value-due-to-acidification/.
115 Fears, Darryl. “Study Says U.S. Can't Keep up with Loss of Wetlands.” The Washington Post, WP Company, 8 Dec. 2013, www.washingtonpost.com/national/health-science/study-says-us-cant-keep-up-with-loss-of-wetlands/2013/12/08/c4801be8-5d2e-11e3-95c2-13623eb2b0e1_story.html.
116 Ibid.
117 The Health Effects of Overweight and Obesity. Centers for Disease Control and Prevention, 5 June 2015, www.cdc.gov/healthyweight/effects/.
118 Datz, Todd, and Emanuele Di Angelantonio. As Overweight and Obesity Increase, so Does Risk of Dying Prematurely. Harvard T.H. Chan School of Public Health, 13 July 2016, www.hsph.harvard.edu/news/press-releases/overweight-obesity-mortality-risk/.
119 The Healthcare Costs of Obesity. The State of Obesity, stateofobesity.org/healthcare-costs-obesity/. Accessed 6 Sept. 2017.
120 Levine, James A. “Poverty and Obesity in the U.S.” Diabetes, American Diabetes Association, Nov. 2011, www.ncbi.nlm.nih.gov/pmc/articles/PMC3198075/.
121 Extent of Mountaintop Mining in Appalachia - 2009. Appalachian Voices, 2009, www.ilovemountains.org/reclamation-fail/details.php#extent_study. Accessed 5 Sept. 2017.
122 Norton, Susan B., et al. “The Effects of Mountaintop Mines and Valley Fills on Aquatic Ecosystems of the Central Appalachian Coalfields.” US Environmental Protection Agency, Mar. 2011, cfpub.epa.gov/ncea/risk/recordisplay.cfm?deid=225743&CFID=49904863&CFTOKEN=86768683.
123 Mine Safety and Health Administration Coal Mine Safety and Health Report of Investigation: Surface Impoundment Facility Underground Coal Mine. Mine Safety and Health Administration, 2001, p. 1 arlweb.msha.gov/impoundments/martincounty/martincountytext.pdf. Accessed 6 Sept. 2017.
124 Skinner, Samuel K. and William K. Reilly. “The Exxon Valdez Oil Spill: A Report to the President.” The US Department of Transportation and Environmental Protection Agency, May 1989, p. 1, www.uscg.mil/history/webshipwrecks/ExxonValdezNRT1989Report.pdf.
125 The Human Cost of Coal. Appalachian Voices, ilovemountains.org/the-human-cost. Accessed 5 Sept. 2017.
126 Shea, Shannon Brescher. “Acid Rain, Rain Go Away: Some Adirondack Lakes Are Showing Promising Signs of Recovery.” New York State Conservationist, New York State Department of Environmental Conservation, Apr. 2008, www.dec.ny.gov/pubs/43763.html. Accessed 21 Feb. 2015.
127 Ibid.
128 “Effects of Acid Rain – Materials.” US Environmental Protection Agency, www3.epa.gov/acidrain/effects/materials.html. Accessed 28 Nov. 2015.
129 “Acid Rain Program Benefits Exceed Expectations. Clean Air Market Programs, US Environmental Protection Agency, grist.files.wordpress.com/2008/06/benefits.pdf.
130 Janz, Wes. This Is Flint, Michigan, in All Its Pain and All Its Glory. Grist, 17 Feb. 2011, grist.org/urbanism/2011-02-15-this-is-flint-michigan/.
131 Martinez, Michael. Flint, Michigan: Did Race and Poverty Factor into Water Crisis? Cable News Network, 28 Jan. 2016, www.cnn.com/2016/01/26/us/flint-michigan-water-crisis-race-poverty/.
132 Adams, Dominic. “Flint Still Tops in Nation for Violent Crime but Officials See Signs of Hope.”MLive.com, 16 Sept. 2013, www.mlive.com/news/flint/index.ssf/2013/09/flint_still_tops_in_nation_for.html.
133 Sparks, Sarah D. “Student Mobility: How It Affects Learning.” Education Week, 11 Aug. 2016, www.edweek.org/ew/issues/student-mobility/.
134 Ingraham, Christopher. Moving as a Child Can Change Who You Are as an Adult. The Washington Post, 13 June 2016, www.washingtonpost.com/news/wonk/wp/2016/06/13/moving-as-a-child-can-change-who-you-are-as-an-adult/.
135 Paul, Pamela. Does Moving a Child Create Adult Baggage? The New York Times, 9 July 2010, www.nytimes.com/2010/07/11/fashion/11StudiedMoving.html.
136 Cooper, Rob. “Love Thy Neighbour No More: Disappearance of Community Spirit as 70% Admit They Don't Know Who Lives next Door.” Daily Mail Online, Associated Newspapers, 28 Nov. 2011, www.dailymail.co.uk/news/article-2067048/Community-spirit-disappeared-70-admitting-dont-know-neighbours-name.html.
137 Chalabi, Mona. How Many Times Does The Average Person Move? FiveThirtyEight, 29 Jan. 2015, fivethirtyeight.com/datalab/how-many-times-the-average-person-moves/.
138 The Extinction Crisis Is Far Worse than You Think. Cable News Network, Dec. 2016, www.cnn.com/interactive/2016/12/specials/vanishing/index.html.
139 How Many Species Are We Losing? WWF, wwf.panda.org/about_our_earth/biodiversity/biodiversity/. Accessed 12 July 2017.
140 Knapton, Sarah. World Facing Biggest Mass Extinction since Dinosaurs - with Two Thirds of Animals Wiped out in 50 Years. The Telegraph, 27 Oct. 2016, www.telegraph.co.uk/science/2016/10/27/world-facing-biggest-mass-extinction-since-dinosaurs-warn-expert/.
141 “Climate Change 2007: Synthesis Report.” United Nations Intergovernmental Panel on Climate Change, pp. 13-14, www.ipcc.ch/pdf/assessment-report/ar4/syr/ar4_syr_full_report.pdf.
142 Jeftic, Ljubomir, et al. “Marine Litter: A Global Challenge.” United Nations Environmental Programme, 2009, p. 117, www.unep.org/regionaLseas/marinelitter/publications/docs/Marine_Litter_A_Global_Challenge.pdf. Accessed 2 Dec. 2016.
143 Parker, Laura. Eight Million Tons of Plastic Dumped in Ocean Every Year. National Geographic, 13 Feb. 2015, news.nationalgeographic.com/news/2015/02/150212-ocean-debris-plastic-garbage-patches-science/.
144 “Time it takes for garbage to decompose in the environment.” NH Department of Environmental Services, www.des.nh.gov/organization/divisions/water/wmb/coastal/trash/documents/marine_debris.pdf.
145 Harris, William. How Long Does It Take for Plastics to Biodegrade? How Stuff Works, science.howstuffworks.com/science-vs-myth/everyday-myths/how-long-does-it-take-for-plastics-to-biodegrade.htm.
146 Kottasova, Ivana. “More Plastic than Fish in Oceans by 2050.” CNN Money, Cable News Network, 19 Jan. 2016, money.cnn.com/2016/01/19/news/economy/davos-plastic-ocean-fish/.
147 “Marine litter – trash that kills.” United Nations Environmental Programme, 2001, p. 10, www.unep.org/regionalseas/marinelitter/publications/docs/trash_that_kills.pdf. Accessed 13 Apr. 2016.
148 Weiss, Kenneth R. Altered Oceans, Part Four: Plague of Plastic Chokes the Seas. Los Angeles Times, 2 Aug. 2006, www.latimes.com/world/la-me-ocean2aug02-story.html.
149 Methane: The Other Important Greenhouse Gas. Environmental Defense Fund, www.edf.org/methane-other-important-greenhouse-gas. Accessed 25 Aug. 2017.
150 Jones, Ernesta. “EPA Releases First-Ever Standards to Cut Methane Emissions from the Oil and Gas Sector.” EPA, Environmental Protection Agency, 12 May 2016, www.epa.gov/newsreleases/epa-releases-first-ever-standards-cut-methane-emissions-oil-and-gas-sector.
151 Augenbraun, Harvey, et al. The Global Methane Cycle. NASA, icp.giss.nasa.gov/education/methane/intro/cycle.html.
152 25%141 of 6%143 = 1.5%
153 Overview of Greenhouse Gases: Methane Emissions. Environmental Protection Agency, www3.epa.gov/climatechange/ghgemissions/gases/ch4.html.
154 Christenson, Scott C. and Isabelle M. Cozzarelli. “What Happens to the Waste in Landfills?” The Norman Landfill Environmental Research Site, US Geological Survey, Aug. 2003, pubs.usgs.gov/fs/fs-040-03/.
155 “Investigation of Cancer Incidence and Residence Near 38 Landfills with Soil Gas Migration Conditions: New York State, 1980-1989.” New York Department of Health, July 1998, p. iii, www.energyjustice.net/files/lfg/nys-cancer.pdf.
156 Toxic Landfill Sites Linked to Birth Defects. BBC News, 7 Aug. 1998, news.bbc.co.uk/2/hi/health/146634.stm.
157 LaCapra, Véronique. Confused about Bridgeton, West Lake Landfills? Here's What You Should Know. St. Louis Public Radio, 20 Oct. 2015, news.stlpublicradio.org/post/confused-about-bridgeton-west-lake-landfills-heres-what-you-should-know.
158 LaCapra, Véronique. Landfill Fire Threatens Nuclear Waste Site Outside St. Louis. NPR, 3 Nov. 2015, www.npr.org/2015/11/03/454010066/landfill-fire-threatens-nuclear-waste-site-outside-st-louis.
159 LaCapra, Véronique. EPA Analysis: Neighbors Could Be At Risk If Landfill Fire Reaches Radioactive Waste In Bridgeton. St. Louis Public Radio, 31 Mar. 2014, news.stlpublicradio.org/post/epa-analysis-neighbors-could-be-risk-if-landfill-fire-reaches-radioactive-waste-bridgeton.
160 Nenonan, Noora, et al. “Global Estimates of Occupational Accidents and Work-Related Illnesses 2014.” Workplace Safety & Health Institute, 2014, p. 1, www.wsh-institute.sg/files/wshi/upload/cms/file/Global%20Estimates%20of%20Occupational%20Accidents%20and%20Work-related%20Illness%202014.pdf.
161 Nenonan. “Global Estimates.” P. 2.
162 “World.” CIA World Factbook. www.cia.gov/library/publications/the-world-factbook/geos/xx.html. Accessed 19 Aug. 2017.
163 The combined GDPs of all countries, a.k.a. the gross world product, was an estimated $75.27 trillion in 2016,154 4% of which is $3.01 trillion.
164 Scelfo, Julie. Raising Concerns About Chemicals in Recycled Carpet Padding. The New York Times, 18 May 2011, www.nytimes.com/2011/05/19/garden/tests-on-carpet-padding-show-toxins.html.
165 Milano, Brett. The Unsettling Chemicals around Us. Harvard Gazette, 3 Feb. 2017, news.harvard.edu/gazette/story/2017/02/the-unsettling-chemicals-around-us/.
166 D'Angelo, Chris. 'Extremely High Levels' Of Toxic Pollutants Found In Deepest Part Of Oceans. The Huffington Post, 14 Feb. 2017, www.huffingtonpost.com/entry/toxic-pollutants-mariana-trench-alan-jamieson_us_58a1f7fee4b03df370d8eaac.
167 Known and Probable Human Carcinogens. American Cancer Society, www.cancer.org/cancer/cancer-causes/general-info/known-and-probable-human-carcinogens.html.
168 PM2.5 Monitoring. NYS Dept. of Environmental Conservation, www.dec.ny.gov/chemical/8539.html.
169 “Benzene.” WHO International Programme on Chemical Safety, World Health Organization, www.who.int/ipcs/assessment/public_health/benzene/en/.
170 PM2.5. NYS.
171 Sanborn, M., et al. “Non-Cancer Health Effects of Pesticides: Systematic Review and Implications for Family Doctors.” Canadian Family Physician, College of Family Physicians of Canada, Oct. 2007, www.ncbi.nlm.nih.gov/pmc/articles/PMC2231436/.
172 Ibid.
173 Bauer, M.D. Brent A. “What Is BPA, and What Are the Concerns about BPA?” Mayo Clinic, Mayo Foundation for Medical Education and Research, 11 Mar. 2016, www.mayoclinic.org/healthy-lifestyle/nutrition-and-healthy-eating/expert-answers/bpa/faq-20058331.
174 Maugh, Thomas H. Study Links Pesticide to ADHD in Children. Los Angeles Times, 16 May 2010, articles.latimes.com/2010/may/16/science/la-sci-pesticides-20100517.
175 Ascherio, Alberto, et al. “Pesticide Exposure and Risk for Parkinson's Disease.” Annals of Neurology, Wiley Subscription Services, Inc., 26 June 2006, onlinelibrary.wiley.com/doi/10.1002/ana.20904/abstract.
176 Zhang, Jianmin, et al. Pesticide Exposure and Suicidal Ideation in Rural Communities in Zhejiang Province, China. World Health Organization, 28 July 2009, www.who.int/bulletin/volumes/87/10/08-054122/en/.
177 Storrs, Carina. Report: Pesticide Exposure Linked to Childhood Cancer, Lower IQ. Cable News Network, 14 Sept. 2015, www.cnn.com/2015/09/14/health/pesticide-exposure-childhood-cancer/.
178 Sifferlin, Alexandra. The Link Between Aerial Mosquito Spraying and Autism. Time Health, 29 Apr. 2016, time.com/4313156/mosquito-spraying-autism-pesticides/.
179 PM2.5. NYS.
180 Rapaport, Lisa. Toxic Chemicals Tied to $340 Billion in U.S. Health Costs and Lost Wages. Reuters, 17 Oct. 2016, www.reuters.com/article/us-health-chemicals-environment-idUSKBN12H2KB.