
The Metrics
Workers |
||
|
40% |
|
Environment |
||
|
40% |
|
Community |
||
|
40% |
|
Additional Factors |
||
Workers |
||
|
40% |
|
Environment |
||
|
40% |
|
Community |
||
|
40% |
|
Additional Factors |
||
Each company’s CR Rankings would be determined by the ten main metrics above. To convert metric scores into rankings, each metric has a weighted percentage that determines how much it factors into the appropriate sub-ranking. For example, a company’s Carbon Footprint makes up 40% of its Environment score while its Water Use only accounts for 15%, simply because we have deemed the carbon footprint to be more important. For more specifics on each metric, including the math used to calculate it and why the metric matters, see the sections below.
Why these particular ten metrics, you might ask? Well, there are two important qualifications for each CRR metric. The first is that it measure corporate responsibility—that is, the behind-the-scenes ways a business can help or hurt the world. For instance, when a bakery avoids paying its taxes and creates unsafe working conditions, it does harm to the world in a way that isn’t evident when looking at the bakery’s bread in the store. Metrics that measure that kind of harm thus fit well into CRR.
The second qualification is that each metric must help compare different companies in an algorithm-based system. And to work in such a system, each metric must be both universal and quantifiable. In other words, each metric must a.) apply to most of if not all companies and b.) measure something that can be easily quantified through objective data. For instance, pretty much every business on the planet pollutes and pays wages. Furthermore, such pollution and pay are measurable with objective data. Each employee earns an exact yearly amount. Each office building uses a certain number of kilowatts of electricity each year (and thus tons of CO2). By sticking to metrics that are universal and quantifiable, we enable fair comparisons of all companies. What’s more, by doing so we greatly limit the number of subjective judgment calls that need to be made, making CR Rankings all the fairer for businesses and all the easier for the government to implement.
However, there will always be some aspects of corporate responsibility that will not be both universal and quantifiable. Thus, the eleventh metric—Additional Factors—will cover the rest. The Corporate Responsibility Bureau (CRB) will, through this metric, add or subtract points to individual companies when deserving—for example adding points for creating a cheap new lighting system for the extreme poor, or subtracting points for trying to report a fake number of gallons of gas burned.
With these eleven metrics combined, we believe we have created a system that measures corporate responsibility in a way that is comprehensive, simple, and fair.
Note, however, that the exact metrics CR Rankings use and the weighted percentages each metric is given would all be subject to change. As decided by the CRB, metrics could be created, eliminated, split, or combined (so long as they are all universal and quantifiable). What we present here is our proposal for the starting point.
Distribution of Wealth
The Metric
: How evenly a company distributes its payThe Math
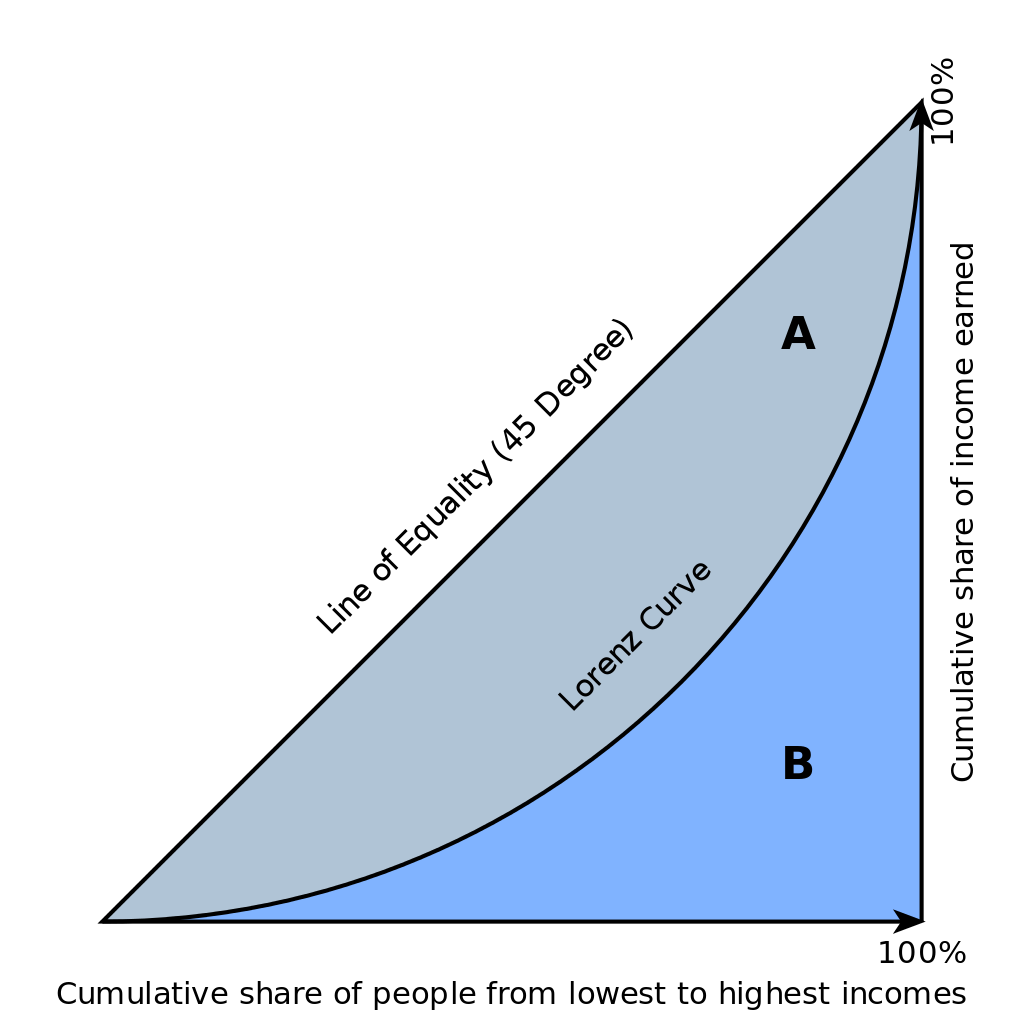
: Reverse Gini coefficient (see graph below) =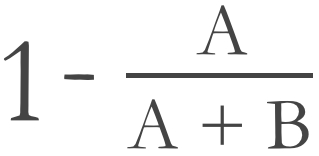
Reidpath/Wikipedia
To calculate the Gini coefficient, the “Lorenz curve” graphs out, for each company, the percentage of total worker compensation (y) given to that bottom percent of workers (x). So, for example, having a y-value of 13% at an x-value of 20% means the lowest paid 20% of workers earn 13% of all total pay. Each point is thus plotted out from left to right and generally forms a curved line. If a company were to give everyone equal pay, then the Lorenz curve would be a straight, diagonal line (and would then match up with the Line of Equality). The more unequally pay is distributed, the farther the Lorenz curve bends toward the bottom right corner. Mathematically, the Lorenz curve splits the triangle in the graph into two sections. With the top left A and the bottom right B, A/(A + B) gives the Gini coefficient. The Gini coefficient ranges from zero to one, zero representing perfect equality, one total inequality. The Gini coefficient was developed over a century ago by Italian statistician Corrando Gini, but it is still generally considered the best basic measurement of income inequality. With no need to reinvent the wheel, we therefore use the Gini to measure the inequality in each company’s distribution of wealth.
One small note is that all CRR metrics have been set up in such a way as to yield the highest scores for the best companies and the lowest scores for the worst. Since the Gini coefficient normally works opposite to this scheme, we have subtracted from 1 to reverse the numbers.
Percentage of Workers Ranking
: 40%Data Needed
:- Total wages given to each employee in all forms of compensation (collected by the IRS with forms 1040, W-2, and 1099 MISC for individuals and forms W-2, W-3, 1120, and 1120S from businesses)
- Total hours worked by each employee (also newly including employee’s age, gender, and race/ethnicity) (FLSA required wage records now to be submitted as part of each employee’s W-2 form)
- Employee verification of total yearly hours worked (on individual tax return form)
- Employee indication of whether part-time work was or was not by choice on individual tax return form
- Records of all corporate purchases (by item type, item quantity, and EID of company purchased from, if available; this includes all raw materials, commercially packaged materials, and services rendered)
How It Works
: The Distribution of Wealth metric ranks companies according to how well they distribute their pay to all of their workers. The more even the distribution of wealth, the higher the company’s ranking will be. The more wealth is concentrated at the top, the lower the ranking.
Why We Need It
: The Distribution of Wealth metric provides a powerful incentive for companies to pay their employees more evenly. By doing so, the DOW metric would go a long ways towards reducing income inequality.Over the last couple of centuries we have done quite a bit to tackle inequality. We have created government initiatives like progressive tax codes, Medicaid, food stamps, Pell Grants, earned income and child tax credits, public housing, Head Start, and public schooling. All of these programs redistribute many hundreds of billions of dollars a year, helping level the playing field by funneling money to and enfranchising the poor. But despite these massive redistributive measures, inequality has continued to steadily rise, for the last several decades here in the US and for the last couple centuries globally. We discuss the failure of such programs to address income inequality at greater length in Our Current Approach Is Doomed to Fail, but the basic idea is that these government initiatives are outmatched. Much less, these programs do little to nothing to change the basic forces of capitalism. So long as capitalism rewards companies that funnel money towards the rich and increase inequality, they will continue to do so.
The DOW metric, however, would give companies their first real financial incentive to lower inequality in their payrolls. Thus, with time, we could stand to see a major global reduction in the gap between the rich and the poor. Reducing that gap would then ease all kinds of problems with it: malnutrition, lack of health care, government deficits, obesity, other diseases of poverty, the racial and gender pay gaps, and of course poverty itself (along with the stress, poor health, and general misery that come with it).
For more on the vital impact of the DOW metric, see Problems CRR Can Help Fix—specifically the sections on Income Inequality, National Deficit and Debt, Diseases of Poverty, Gender Pay Gap, Racial Pay Gap, Obesity Rates, and Exploitation of Unpaid “Internships.”
The Metric
: Comparison of the yearly pay given to the lower half of a company’s workers to the local standard of living. More specifically, the metric would rank the pay of each company at six percentiles—entry-level pay, the 10th percentile, the 20th percentile, the 30th percentile, the 40th percentile, and the 50th percentile.The Math
:C = Median cost of living where the company’s work is done
P = Yearly pay given at each of six percentiles
“Pay” simply means how much someone at each of the six percentiles is paid for their work. So, how much money does someone at the bottom make in one year, how much does someone at the 10th percentile make in one year, etc. This includes all forms of compensation—wages, health care, stock, pensions, tips, bonuses, etc.
“Median Cost of Living,” meanwhile, is essentially how much it costs on average to live near one’s job. More specifically that means the amount of money needed to sustain a family of four by paying median housing, utilities, food, transportation, and health care costs in any given locality. If these median costs for a locality do not already ensure adequate access to safe housing, clean water, sanitary waste disposal, the fulfillment of basic caloric needs, a K-12 education for all children in the family, and reliable internet access, then the gap between the average estimated cost of fulfilling any of these basic needs and the actual median living costs will be added to the Median Cost of Living monetary sum for each county/city. This is an important distinction in areas where, say, the average person doesn’t have adequate access to clean drinking water or to the internet. The median cost of living for such a locality would therefore still include however much it costs to install plumbing and internet infrastructure.
Percentage of Workers Ranking
: 40%Data Needed
:- Total wages given to each employee in all forms of compensation (collected by the IRS with forms 1040, W-2, and 1099 MISC from individuals; and forms W-2, W-3, 1120, and 1120S from businesses)
- Total hours worked by each employee (also newly including employee’s age, gender, and race/ethnicity) (FLSA required wage records now to be submitted as part of each employee’s W-2 form)
- Employee indication of whether part-time work was or was not by choice (on individual tax return form)
- Records of all corporate purchases (by item type, item quantity, and EID of company purchased from, if available; this includes all raw materials, commercially packaged materials, and services rendered)
- Median yearly housing costs (by locality, globally)
- Median yearly utility costs (electricity, heat, water, gas, internet) (by locality, globally)
- Median yearly food costs (by locality, globally)
- Median yearly transportation costs (by locality, globally)
- Median yearly health care costs (by locality, globally)
- Lowest cost for safe basic housing (by locality, globally)
- Lowest cost for clean water access (by locality, globally)
- Lowest cost for sanitary waste disposal (by locality, globally)
- Lowest cost for fulfillment of basic caloric needs (by locality, globally)
- Lowest cost for K-12 education (by locality, globally)
- Lowest cost for reliable internet access (by locality, globally)
How It Works
: The PRLSL Metric ranks companies by how well their lower-level employees can afford to live in the areas where they work.Even if a company distributes its pay evenly among all employees (which would score it a high ranking on the Distribution of Wealth metric), this still might not ensure the employees are actually paid well. In other words, it could be the case that everyone gets paid similar yet low amounts. A factory owner in China, for example, could pay all one thousand of his employees the same $5 a day. Surely we would not want to just reward such a company with high rankings for its equality of pay if the employees don’t make enough to buy food and pay rent. On the flip side, a company could get a low ranking on the Distribution of Wealth ranking even while it actually still pays its lowest employees rather well compared to their peers. A US car company might, for example, pay its executives hundreds of millions yet still pay its factory workers more than those who assemble cars in Japan and Korea. That company should still get low rankings for its poor distribution of pay, sure, but it should also be rewarded for giving its factory workers enough to live well.
Thus, in addition to the Distribution of Wealth metric we have the Pay Relative to Local Standard of Living metric. The PRLSL metric ranks each company by how well its lower-paid half of workers can get by on their salaries.
Why We Need It
: Simply put, there are plenty of workers out there who don’t make enough money to make ends meet. Everyone working a full-time job should be able to afford the basics, to put food on the table and a roof over one’s head. The Pay Relative to Local Standard of Living metric would push companies to finally end such unnecessary hardship for the working poor.It’s important to note here that many would defend such low-paying jobs in the market because, hey, we all start somewhere. That low pay should then motivate you to pull yourself up by your bootstraps and fight for something better, they say. To some degree that’s absolutely true. Some amount of inequality in the workplace is quite a healthy motivator. Why would anyone go back to school and apply for new, more difficult jobs if it didn’t mean getting higher pay? That being said, though, some people will always have to work the lower-paying jobs. Someone will always have to be the one to serve the food, to sweep the floors, and to answer the phones. Shouldn’t those hardworking someones still be paid enough to live decent lives? As income inequality rises, however, getting enough pay to make ends meet becomes harder and harder for those at the bottom. The PRLSL metric would work to reverse that trend.
More specifically, the PRLSL metric pushes companies to do two important things. First, it encourages them to pay their workers well enough to get by even where it’s more expensive to live. Want to locate a hedge fund office in Manhattan? Okay, great. However, the cost of living there is much higher than it is in, say, Ohio. So if you want to pay your janitors and security guards the same $10 wage that you do at your Cincinnati office, then be prepared to get a lower CR Ranking with the PRLSL metric. Like all other companies, that hedge fund would be pushed to pay its low-wage workers enough to get by, even in more expensive locations.
Second, the PRLSL metric would push businesses to legitimately pay their low-wage workers well where the cost of living is lower, too. In other words, businesses often move their operations to places where the cost of living is low. If your employees would pay less for rent in Cincinnati, then why not move the business to Cincinnati because you won’t have to pay as high of salaries for your employees to live just as well? For the most part such trimming of costs just makes good economic sense. After all, it means cheaper products for the rest of us to buy. The problem is when moving jobs to where the local cost of living is the lowest turns into exploitation. Moving your jeans company to Bangladesh to take advantage of a lower cost of living isn’t necessarily bad in itself. What’s bad is to not pay these workers enough to escape substandard housing and to have decent health care. At $19 a month,1,2 the minimum wage often paid to factory workers there is definitely not enough to afford such basics. The PRLSL metric would push such companies to shape up and pay livable wages no matter where its workers live.
For more on the benefits brought from the Pay Relative to Local Standard of Living metric, see the Problems CRR Would Help Fix within the Why CRR page—specifically the sections on Income Inequality, Diseases of Poverty, Racial Pay Gap, Obesity Rates, and Exploitation of Unpaid “Internships.”
The Metric
: How well each company protects the safety and health of its employees. That means a.) the number of work-related illnesses, injuries, and deaths per 100 employees each year, and b.) the average Employee Rating of Safety & Health for each company, that is, how well each company’s employees rate it on seven questions given each year as part of the federal individual tax return.The Math
:
E = Total number of full-time employees (with each part-time employee counting as a fraction of one relative to how many hours were worked during the year)
F = Fault of employer for illness, injury, or death, as judged subjectively by physician or, when self-reported, employee on a 0 to 10 scale
I = Number of injuries, illnesses, and deaths per each type
P = Total number of points from seven Employee Rating of Safety & Health questions given to all employees (part-time employees will have their points multiplied by same fraction used to calculate E, that is, the part-time worker’s yearly hours as a fraction of the average full-time employee’s yearly hours)
S = Average severity of each injury/illness type, as assigned subjectively from 0 to 100 by the CRB
Percentage of Workers Ranking
: 20%Data Needed
:- The death of any employee from a work-related incident or the in-patient hospitalization of three or more employees as a result of a work-related incident (self-reported to OSHA within eight hours of incident in accordance with the OSH Act)
- Listed work-related injuries and illnesses by company (forms 300, 300A, 301, which already must be filled out but would now be submitted to federal government at regular intervals)
- Employee list of any additional work-related illnesses and injuries (answered on addendum to the individual tax return form)
- Work-related illnesses, injuries, and deaths as diagnosed by any medical professional
- Employee Rating of Safety and Health questions (answered on addendum to the individual tax return form)
- Listed violations of all worker safety laws (documented by OSHA)
- Records of all corporate purchases (by item type, item quantity, and EID of company purchased from, if available; this includes all raw materials, commercially packaged materials, and services rendered)
How It Works
: The better a company protects its workers’ safety and health, the better it would do with the WS&H metric. That means preventing injuries, illnesses, deaths, harassment, and assault, as well as reducing stress, providing more healthful food and beverages, and giving more scheduling flexibility.The first half of the Safety & Health metric ranks companies by the number of work-related injuries, illnesses, and deaths it has helped cause in the prior year. These ailments would be those reported by the business itself, by any physicians that see the employees as patients, and/or by the employees themselves. The fewer injuries, illnesses, and deaths per one hundred employees (and the less harmful the illnesses and injuries at that), the higher the CR Ranking.
The second half of the Safety & Health metric will rank a company by how well its employees rate its protection of their safety and health. Seven questions will be added to the Individual Tax Return that every working American fills out every year, each to be rated from 0 to 10:
- How well do you feel your company ensures your safety at the workplace, specifically in terms of providing proper housing and equipment?
- How well do you feel your company ensures your safety at the workplace, specifically in terms of keeping the workplace free of hazardous materials and chemicals?
- How well do you feel your company ensures your safety at the workplace, specifically in terms of preventing and punishing harassment and assault (sexual or otherwise)?
- If you work full-time (35 or more hours a week), to what extent would you say you are overworked (i.e., made to work more hours than you desire and/or have requested to work)?
- How well do you feel your employer provides healthful food and beverage options at work and/or makes it easy for you to provide such healthful options yourself?
- To what extent does your employer give you the time off and scheduling flexibility to consistently take care of your family, health, and career development needs (all without punishing you for doing so)? This includes but is not limited to:
- Child care
- Caring for an ailing relative
- Physical exercise
- Mental health breaks
- Pursuing a degree or other outside education
- How would you rate your average on-the-job stress levels?
As with all other CRR metrics, the average overall score per employee for each company with these seven questions will then be ranked relative to all other companies.
On top of those two measures, the CRB would also have the right to subjectively reduce (or increase) a company’s Worker Safety & Health ranking based on that company’s listed violations of safety standards, as provided by the Occupational Safety & Health Administration or any other applicable government agency.
Why We Need It
: With the Worker Safety & Health metric, businesses would have good reason to work a lot harder to keep their employees safe, healthy, and happy.That would first mean bringing up the safety standards of unsafe workplaces, mostly those overseas where regulations aren’t as strict as they are here in the US (like the decrepit factory that collapsed in Bangladesh in 2013 and killed over a thousand people).
However, it would also mean getting companies everywhere to go far beyond the bare minimum that they now strive to merely pass. Despite the rules we currently have on the books for worker safety, businesses still regularly expose their workers to plenty of toxic chemicals. Employees regularly get injured and even die in preventable accidents. Our workforce is chronically overstressed. Our inflexible work schedules tend not to allow enough time for physical exercise. That same scheduling inflexibility is also one of the leading reasons that women get paid less than men. All of these problems put quite an unnecessary burden on our workforce and drive up our already-out-of-control health care costs. The Worker Safety & Health metric would push businesses to not just pass local safety laws, but to go much further, to do everything they can to improve the safety and health of their employees.
For more on all of the positive change that the WS&H metric would bring, see Problems CRR Would Help Fix in the Why CRR page—more specifically the sections on National Health Care Bill; Gender Pay Gap; Cancer Rates; Workplace Harassment and Assault; Obesity Rates; and Workplace Injuries, Illnesses, and Deaths.
The Metric
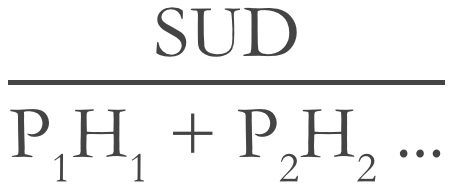
: The amount each company contributes to global warming. More specifically, each company would be ranked by its carbon dioxide equivalent per one service unit-dollar (i.e., how much it warms the planet per one dollar’s worth of product it creates for the world).The Math
:SUD = Service Unit Dollars = (Total service units sold) x (Universal mean price per service unit)
CDE = Carbon Dioxide Equivalent = 
CD = Carbon dioxide equivalent released per square mile of land destroyed, per ecosystem type
CE = Tons of carbon dioxide equivalent released per one kilowatt of electricity in location of product sale (given breakdown of electricity sources there)
Cg = Tons of carbon dioxide released per one gallon of gasoline burned
D = Net destruction of all land, in square miles and by ecosystem type and location
E = Total yearly electricity consumed by company (in kilowatts)
EP = Electricity consumption per hour of use per specific product (in kilowatts)
F = Amount of fuel directly burned, in kilograms and by fuel type
f = Tons of nitrogen fertilizer used
GF = Tons of each greenhouse gas directly or indirectly produced per kilogram of fuel type burned
GE = Tons of each greenhouse gas directly or indirectly produced per kilowatt of electricity produced, per type of electricity source (i.e., coal vs solar vs nuclear, etc)
g = Gasoline consumption per hour of use per specific device (in gallons)
L = Livestock owned, per type of animal
l = Estimated average product lifetime of all service units in that category (in years)
M = Tons of methane produced per year, per animal type
Nf = Tons of nitrous oxide produced per kilogram of nitrogen contained in fertilizer
P = Percentage of company’s electricity coming from each type of energy source (i.e., coal vs solar vs nuclear, etc)
S = Service Units
U = Average usage per year of one item in that service unit category (in hours)
WG = GWP of greenhouse gas in question
WM = GWP of methane
WN = GWP of nitrous oxide
*GWP is a gas’s Global Warming Potential, which tells us roughly how much one ton of that gas warms the planet versus a ton of another gas. Carbon Dioxide has a GWP of 1 since it’s the baseline unit that all others are compared to. Methane has a GWP of about 32. Nitrous oxide is about 281, etc. GWP numbers are always estimates, but CR rankings would be based on the best, most recent estimates (i.e., by default the IPCC’s latest GWP estimates for a 100-year timespan).
The general formula for all of the Environment metrics is Service Unit-Dollars / Environmental Impact. In other words, the more environmental impact a company has per one dollar’s worth of product it creates for the world, the lower its ranking will be. For a company’s Carbon Footprint, that means the more tons of carbon dioxide it creates per one dollar’s worth of computer it sells—or per one dollar’s worth of bicycle, toothbrush, or whatever—the lower its Carbon Footprint ranking.
Carbon Dioxide Equivalent essentially means the total tons of carbon dioxide produced. The only difference with CDE is that all warming gases other than CO2 (like methane or nitrous oxide) are also converted to how many tons of CO2 would be needed to get the same warming effect and then added to the CDE total. The CDE formula thus equals a company’s total global warming impact—from all fuel burned, electricity used, livestock kept, fertilizer used, forests cut down, and products used (i.e., the electricity and fuel consumption directly used by the products a company sells). So for Ford, that last part means its Carbon Footprint ranking accounts for the warming effects of not only the making one of its trucks but also the average amount of gasoline such a truck would use throughout its lifetime. The same goes for the electricity or battery use of, say, a vacuum cleaner, dishwasher, or any other power-using device.
Percentage of Environment Ranking
: 40%Data Needed
:- Records of all corporate sales (by item type, item quantity, item mass, materials of item plus packaging, locality of sale, price, and EID of company sold to, if available and applicable)
- Records of all corporate purchases (by item type, item quantity, and EID of company purchased from, if available; this includes all raw materials, commercially packaged materials, and services rendered)
- Records of all resources harvested directly from the land, air, and sea (by material type, quantity, and method of extraction; includes both living things and nonliving raw materials)
- Documentation of any destruction or alteration of land, sea (in all building projects and resource harvesting, etc, including but not limited to mining, logging, construction)
- Records of all materials chemically altered (by type and mass of each reactant and product)
- Documentation of any corporate time and/or money going to environmental conservation projects or research
- Total number of livestock owned (by type of animal and portion of year kept, if applicable)
- Total corporate electrical usage (in kilowatt-hours by source locations and fuel types)
How It Works
: The Carbon Footprint metric measures each company’s contribution to global warming. The more that company warms the planet, the worse its resulting CR Ranking. Given that the CF metric accounts for a whole 40% of a company’s Environment ranking, a company that wants to raise its CR Ranking and thus attract more customers would then have great reason to do everything it can to lower its carbon footprint.Why We Need It
: Global warming is arguably the number one threat posed to the continuation of our species. Even if we humans do survive the warming of our planet, it will almost certainly be with increased flooding, drought, famine, loss of land, loss of biodiversity, destruction of coral reefs, and costlier and more damaging meteorological storms of all sorts. In addition to any direct human deaths caused by these effects of global warming, we will face trillions of dollars in housing and infrastructure damage in the coming decades, as well as the increased likelihood of war over scarcer food and water. With the Carbon Footprint metric, CR Rankings would provide a strong financial incentive for businesses to cut their carbon footprints as much as possible. CRR would thus spark a major change from the climate change status quo, and it would arguably do much more than any other human initiative thus far to curb the release of greenhouse gases and stop the warming of the planet.For more on global warming and the impact CRR would have on it, see our more detailed discussion of the issue in Problems CRR Would Help Fix in the Why CRR page.
The Metric
: The harm done by each company’s production of air, water, and land pollution (in all ways except for warming the planet)The Math
:
H = Harmfulness factor for each pollutant
P = Tons of each pollutant
In other words, this metric measures the weighted harm done per service unit-dollar by all non-greenhouse air, water, and land pollutants. The harm of each pollutant is calculated as the tons of said pollutant produced per service unit multiplied by the weighted harmfulness factor. A pollutant’s harmfulness factor is a number which gives its relative harmfulness to the world as compared relatively to all other known pollutants. The CRB will create, manage, and regularly update a list with the HF of all known pollutants, giving a score of 100 to what is believe to be the most harmful then ranking all others subjectively from 0 to 100 accordingly. This list will be made using any and all available scientific knowledge of each pollutant for guidance.
Percentage of Environment Ranking
: 30%Data Needed
:- Records of all corporate sales (by item type, item quantity, item mass, materials of item plus packaging, locality of sale, price, and EID of company sold to, if available and applicable)
- Records of all corporate purchases (by item type, item quantity, and EID of company purchased from, if available; this includes all raw materials, commercially packaged materials, and services rendered)
- Records of all resources harvested directly from the land, air, and sea (by material type, quantity, and method of extraction; includes both living things and nonliving raw materials)
- Documentation of all building projects and resource harvesting that involve destruction or alteration of land (e.g., mining, logging, construction, etc)
- Documentation of any destruction or alteration of land, sea (in all building projects and resource harvesting, etc, including but not limited to mining, logging, construction)
- Records of all materials chemically altered (by type and mass of each reactant and product)
- Estimates of pollutants from farm runoff (including nutrients, sediments, and pathogens, with estimates based on terrain, land use, buffers, and periodic water testing above and below runoff sources)
How It Works
: The Non-Greenhouse Pollution metric ranks companies by how much they contribute to all other forms of air, water, and land pollution (outside of greenhouse gases). Such pollution includes sulfur and nitrogen compounds that lead to acid rain, CFCs that deplete the ozone layer, mercury and all other carcinogens that raise the risk of cancer, excess fertilizers that lead to freshwater eutrophication, excess antibiotics that help lead to antibiotic resistance, and any other chemical compounds produced by companies that can have a negative impact on the health of the environment in any way.Why We Need It
: Businesses create most of the world’s pollution. That pollution worsens our health, raising rates of a wide swath of illnesses, from asthma to pneumonia to cancer. It also cripples the world’s ecosystems and has driven scores of species to extinction. If all of that harm wasn’t bad enough in itself, pollution costs us trillions of dollars each year. The Non-Greenhouse Pollution metric, however, would push businesses to steadily produce less and less pollution. With CR Rankings, we could very likely see the biggest single reduction in the production of harmful chemicals in the history of humankind.For more on what the Non-Greenhouse Pollution metric would accomplish, see Problems CRR Would Help Fix in the Why CRR page. More specifically, check out the sections on Antibiotic Resistance; Nuclear Waste; Cancer Rates; Outdoor Air Pollution; Cultural Eutrophication; Wetland Destruction; Mountaintop Removal; Acid Rain; Species Endangerment and Extinction; Accumulation of Plastic in the World’s Oceans; Landfills; Workplace Injuries, Illnesses, and Deaths; and Toxic Chemical Ingestion.
The Metric
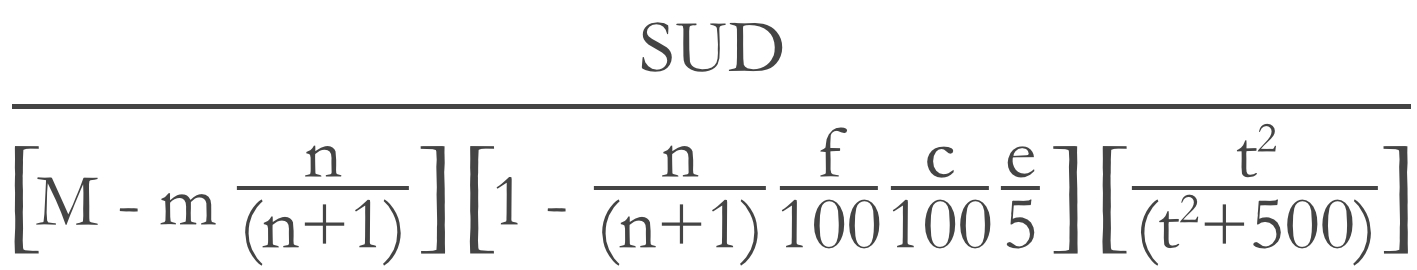
: The biodegradability and/or recyclability of a company’s products and waste. The more biodegradable and/or recyclable the materials a company creates, the better it will do with this metric.The Math
:
The denominator portion of formula should be run for each type of material produced, with result from each added up for the final denominator. (We would have more accurately shown this here with subscripts 1, 2, etc, but that would’ve made an already rather complex formula maddening to look at and comprehend.)
c = Percent consumer frequency of recycling material versus throwing it in trash (weighted average in localities of sales)
e = Ease of separating and recycling the recyclable parts of product/packaging (on 0-5 scale, to be decided subjectively for each product by CRB)
f = Percent of material sold in localities with both free municipal pickup of material and recycling facilities to process the material
M = Tons of material produced
m = Tons of material recycled directly by company
n = Average number of times material type can be successfully recycled before becoming trash
t = Time in years for material to biodegrade
The Biodegradability and Recyclability metric probably has the most tricky math of all the CRR metrics. As with the other Environment metrics, the general formula is Service Unit-Dollars / Environmental Impact.
Overall, that entire denominator combines together to form an estimate of the mass of unrecycled and non-biodegradable material produced. We get this by combining three parts: first, the mass of the material type in question that is not recycled directly by the company M – m[n/(n+1)] multiplied by, second, the average estimated percent of the remaining mass that will not end up being recycled by the consumer [1 – n/(n+1) x f/100 x c/100 x e/5] multiplied by, third, the unrecycled mass’s non-biodegradability factor [t2/(t2+500)] that is, by how much that material will not biodegrade. What we get afterwards is the estimated amount of material left over that will not be recycled or biodegrade. Each company is then ranked by how much such material is created per service unit-dollar (i.e., per amount of service provided to the world).
Percentage of Environment Ranking
: 15%Data Needed
:- Records of all corporate sales (by item type, item quantity, item mass, materials of item plus packaging, locality of sale, price, and EID of company sold to, if available and applicable)
- Records of all corporate purchases (by item type, item quantity, and EID of company purchased from, if available; this includes all raw materials, commercially packaged materials, and services rendered)
- Records of all materials chemically altered (by type and mass of each reactant and product)
- Quantity of all externally recycled materials (by type and mass)
- Recycling capabilities (by locality, globally)
- Average consumer recycling frequency per material type (by locality, globally)
- Rating of the ease of recyclability of all products sold in US (as decided subjectively by CRB based how easy it is to deconstruct and recycle the products themselves and their packaging)
How It Works
: Simply put, the B&R Metric ranks companies by how biodegradable and recyclable their products and waste are. The more biodegradable and recyclable, the better. Really to be more specific, though, companies are directly ranked by how much non-biodegradable and unrecyclable stuff they create—that is by how much junk they create that will sit in a landfill somewhere and not go away. So that also means that simply creating less stuff raises the B&R ranking, too.Why We Need It
: One of the biggest environmental issues of our time is the accumulation of non-biodegradable, unrecycled waste. It clogs expensive, overflowing landfills. It is filling up the oceans with plastic. It makes a major contribution to climate change, magnifies the health hazards of toxins, and ensures that we waste more time, money, effort, and raw materials in making new things because we failed to adequately recycle the old ones.The Biodegradability & Recyclability metric would push companies to make their products steadily more biodegradable and recyclable. This metric would, in other words, push companies to start caring not just about how much the consumer will like their product, but also about how their products will affect the world once they’ve been thrown out. The B&R metric would bring cleaner oceans, fewer landfills, more efficient use of waste, and less global warming.
To learn more about all of the good that the Biodegradability & Recyclability metric would do, see Problems CRR Would Help Fix in the Why CRR page. More specifically, take a look at the sections on Species Endangerment and Extinction, Accumulation of Plastic in the World’s Oceans, and Landfills.
The Metric
: How much water is used to produce a company’s products and servicesThe Math
:S = Water scarcity factor
SUD = Service unit dollars
W = Total liters of water used
The Water Scarcity Factor is a number from one to five that the CRB would designate for all locations globally. The factor ranges from areas of the most plentiful water (1) to the greatest water scarcity (5).
Percentage of Environment Ranking
: 15%Data Needed
:- Records of all corporate sales (by item type, item quantity, item mass, materials of item plus packaging, locality of sale, price, and EID of company sold to, if available and applicable)
- Records of all corporate purchases (by item type, item quantity, and EID of company purchased from, if available; this includes all raw materials, commercially packaged materials, and services rendered)
- Total corporate water usage (by volume, from public-supply systems, private wells, and all other sources)
How It Works
: With the Water Use metric, companies would be ranked by how much water they use. Pretty simple. The more water used to make any particular product or service, the lower the Water Use ranking.The only added layer here is the Water Scarcity Factor. The more scarce water is where a business uses it, the more any water use will count towards that company’s Water Use ranking. So, in other words, using one liter of water in the desert will count the same as using five liters in an area of plentiful water. That way, companies are incentivized to be extra careful with their water use in drier areas—and, really, to start moving more of their water-intensive activities to wetter areas.
Why We Need It
: Water scarcity drives food price hikes, thirst, malnutrition, and diseases of poverty around the world. As billions more people come to occupy Earth in the coming decades, water scarcity is only poised to get much worse. With the Water Use metric, though, CR Rankings would encourage businesses—users of most of the world’s freshwater—to start using a lot less.Agriculture and industry alone account for 88% of all global water use,3 and yet quite a lot of that water gets wasted. An estimated 60-70% of water used by farms, for example, never even makes it to the crops thanks to issues like leaky irrigation channels, evaporation, and water inefficiently draining straight into rivers.4,5 CRR’s Water Use metric would push businesses to use less water and to then be more efficient with the water they do use.
For more on the ways the Water Use metric would positively affect the world, check out the Water Scarcity section of Problems CRR Would Help Fix in the Why CRR page.
The Metric
: How much a company actually pays in taxes compared to the tax rate it should be paying. So that means each company is ranked by the ratio of its effective tax rate paid versus the actual corporate tax rate where a.) the company’s employees work and b.) where the company sells its services and/or products.The Math
: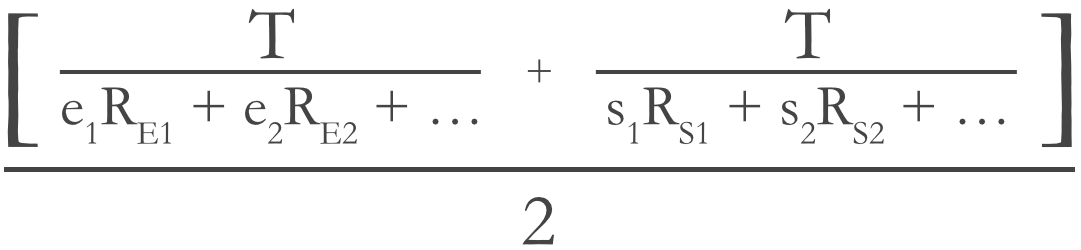
e = Percent of total employees working in each locality
RE = Total corporate tax rate in each locality where employee(s) work
RS = Total corporate tax rate in each locality where products/services have been sold
s = Percent of total sales completed in each locality
T = Total corporate taxes paid
Percentage of Community Ranking
: 40%Data Needed
:- Net corporate revenue after all returns and allowances (collected by the IRS with forms 1120 and 1120S)
- Total corporate taxes paid (collected by the IRS with forms 1120 and 1120S)
- Employment location zip code of each employee (collected by the IRS with forms W-2, 1040)
- Records of all corporate sales (by item type, item quantity, item mass, materials of item plus packaging, locality of sale, price, and EID of company sold to, if available and applicable)
- Records of all corporate purchases (by item type, item quantity, and EID of company purchased from, if available; this includes all raw materials, commercially packaged materials, and services rendered)
How It Works
: The Shouldering the Tax Burden metric assesses to what degree a company pays its taxes versus avoiding them. The more the company pays in taxes versus the actual tax rate where it works and sells its products and services, the higher it will rank with this metric.To calculate this metric, we first assess a company’s effective tax rate, or in other words what percentage of its income did it pay in taxes to various applicable governments. This percentage would then be compared to the actual average tax rate, first, where the company’s employees work and, second, where it sells its products and services. So a company with an actual tax rate of 25% that pays the full 25% would do well here. On the other hand, a company that hides its money in tax havens overseas to avoid paying what it should will rank quite poorly in this metric.
Why We Need It
: As much as we all love to demonize taxes, we absolutely need them. Taxes pay for all of the vital services we take for granted—roads, schools, police, airports, social security, firefighters, hospitals, the military, and on and on. Businesses enjoy the benefits of all of those government services just as much as individuals do, but they’ve become adept at avoiding their fair share of the taxes that pay for those services. Corporate tax avoidance amounts to roughly $100 billion lost here in the US every year.6 Such tax avoidance leads to government deficits, reductions in government services, and higher tax bills for the rest of us. The Shouldering the Tax Burden metric would motivate businesses to avoid the tax avoidance game and pay what they rightly owe.To read more about what the STTB metric would do for our communities, see Problems CRR Would Help Fix on the Why CRR page. More specifically, check out the sections on Corporate Tax Avoidance and National Deficit and Debt.
The Metric
: Percent of total yearly revenue given to charitable organizationsThe Math
:D = Total donations to charitable organizations (in money, goods, and services)
R = Total yearly revenue
Percentage of Community Ranking
: 40%Data Needed
:- Net corporate revenue after all returns and allowances (collected by the IRS with forms 1120 and 1120S)
- Total corporate charitable contributions (collected by the IRS with forms 1120, 1120S, 8283)
- Records of all corporate purchases (by item type, item quantity, and EID of company purchased from, if available; this includes all raw materials, commercially packaged materials, and services rendered)
How It Works
: The Charitable Giving metric would rank companies by how much they give to charity. The higher the percentage of a company’s revenue it donates, the higher the CR Ranking.Donations would obviously include money, but also goods and services. If a grocery store wants to donate excess bread to a food bank or a consulting firm wants to donate its consulting expertise to a non-profit, great! The world should benefit just as much from these donations as from direct cash.
Why We Need It
: Take a look at most any charitable cause and you’ll find a recurring situation: with more money it could be doing so much more. More houses could be built for the poor. More clothing and food could be given to hurricane victims. More arts programs, more medical research, more support for veterans, you name it. With the CG metric, CR Rankings would give companies a strong incentive to do much more to fund all of these great causes.Upon hearing of the need for more charitable funding, though, most people lament that we citizens should be giving more. Well, perhaps we should, but we actually on average already give over 5% of our income to charity.7-9US corporations, on the other hand, made over eight trillion dollars in profits in 2015 but only gave a tiny sliver of those profits (0.98%) to charity.10-12 Arguably corporations should keep the majority of those profits, to invest in new products, research, etc. But just 0.98%?! For a lot that loves to brag in cheesy commercials about how profoundly giving they all are, that’s abysmal.
With the Charitable Giving metric, CR Rankings would encourage companies to give more, to compete to see which company could give the largest percentage of its profits to charity. Most companies can clearly afford to give more, and with this push from the CG metric we could eventually see a doubling, tripling, or even bigger increase in the amount of money given to charities each year. That’s a huge boost for innumerable great causes.
For more on the good that the Charitable Giving metric would do, see Problems CRR Would Help Fix in the Why CRR page. More specifically, check out the sections on Food Waste, Funding for Charities, Cancer Rates, and Landfills.
The Metric
: What percent of a company’s jobs have stayed put in the same place in recent yearsThe Math
: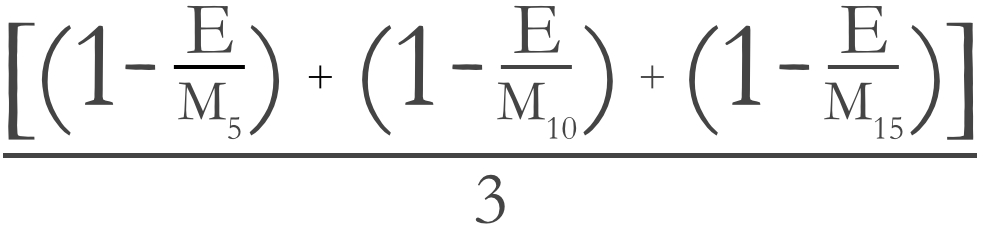
E = Total number of full-time employment positions filled at company in question (with each part-time employee counting as a fraction of one full-time employee relative to how many hours were worked during the year)
M5 = Number of employment positions that have been terminated or relocated at least twenty miles away in the past five years
M10 = Number of employment positions that have been terminated or relocated at least twenty miles away in the past ten years
M15 = Number of employment positions that have been terminated or relocated at least twenty miles away in the past fifteen years
As is the case with all other metrics, the higher the number that comes out, the higher the ranking. Ranking companies by how many jobs are terminated or moved, though, would initially give out rankings in the opposite order. Thus to flip the numbers, we subtract each of those numbers from one (just like we do with the Distribution of Wealth metric). We then add all three of the resulting numbers and divide by three to get the average.
Percentage of Community Ranking
: 20%Data Needed
:- Employment location zip code of each employee (collected by the IRS with forms W-2, 1040)
- List of all new, eliminated, and transferred job positions
- Records of all corporate purchases (by item type, item quantity, and EID of company purchased from, if available; this includes all raw materials, commercially packaged materials, and services rendered)
How It Works
: The Job Location Stability metric ranks companies by how much they keep their jobs set where they already are—that is, instead of zig-zagging them to new locations all around the world each year.So if your offices and factories have stayed put in the same places for decades, then you will rank well with the JLS metric. Move your jobs to different states or countries every time you hear of some slightly cheaper tax rate, then you won’t do so well. More specifically the JLS metric would rank companies by the percentage of employee positions eliminated or relocated at least twenty miles away from the previous location in the last five years, ten years, and fifteen years.
Why We Need It
: With the Job Location Stability metric, communities could gain back a stability that has been steadily lost thanks to globalization.So much of what makes for a strong community is stable, reliable jobs. Such jobs allow a community’s workers to have a sense of security and to work their way up in the world without having to uproot and cut ties with friends and family if they don’t want to do so. The more companies globalize, though, the more easily they can move their jobs around according to whatever the slight economic benefit of the week is. While that job movement might make the company a bit more money, it can wreak havoc on our communities. When a factory or office division shutters its doors to go somewhere else, it often leaves that town to suffer higher unemployment, a decreasing population, and a bevy of psychological disorders like depression and opioid addiction. Corporations will inevitably have to end some job positions and move others, but this metric encourages them to only do so when it is truly necessary.
For more on the problems the Job Location Stability metric would help fix, see Companies Abandoning Communities in the Problems CRR Would Help Fix page.
The Metric
: Any additional factors outside of the other CRR Metrics that the CR Bureau decides should lower or raise a company’s rankingsThe Math
: (There is no set math for the Additional Factors metric. Points would be added or subtracted directly from a company’s CR Rankings.)Percentage of Community Ranking
: —Data Needed
:- Total hours worked by each employee (also newly including employee’s age, gender, and race/ethnicity) (FLSA required wage records now to be submitted as part of each employee’s W-2 form)
- Total wages given to each employee in all forms of compensation (collected by the IRS with forms 1040, W-2, and 1099 MISC from individuals; and forms W-2, W-3, 1120, and 1120S from businesses)
- Listed violations of all worker safety laws (documented by OSHA)
- Employee gender and race/ethnicity (on individual tax return form)
- All lawsuits and complaints filed with all state and federal governments against each company (submitted to the IRS, EPA, OSHA, and all other local, state, and federal government agencies)
- Complaints and/or evidence of wrongdoing filed directly to the CRB
- Documentation of any destruction or alteration of land, sea (in all building projects and resource harvesting, etc, including but not limited to mining, logging, construction)
- Documentation of any corporate time and/or money going to environmental conservation projects or research
- Documentation of any new technologies discovered and/or new products created that could qualify for innovation points
- Records of all corporate purchases (by item type, item quantity, and EID of company purchased from, if available; this includes all raw materials, commercially packaged materials, and services rendered)
How It Works
: The CR Bureau reserves the right to subjectively lower or raise any company’s CR Rankings any amount for any additional factors outside of the scope of the other metrics. The only stipulation is that any additional factors used to rank any company would be explained to the public.Such additional factors include but are not limited to:
Workers
- Discrimination in hiring, firing, or pay (i.e., on the basis of gender, race, religion, sexual orientation, age, or national origin)
- Not delivering on any promised payments or misleading workers about the nature of any such payments (e.g., health care options, pensions, overtime pay, severance pay, maternity pay, stock options, etc)
- Violation of local child labor laws and/or exceeding basic guidelines on child labor set forth by the International Labor Organization
- Evidence of sexual harassment and/or assault that goes beyond what the Worker Safety & Health score reflects, including specific claims of harassment and/or assault reported by individuals directly to the CRB
Environment
- Doing irreparable damage to the environment, in solitary or continued acts that are above and beyond that of normal pollution (e.g., mountaintop removal, rainforest destruction, wetland destruction, oil spills, any other actions contributing to species endangerment or extinction, etc)
- Pollution that more directly endangers human health than usual (e.g., the release of toxic chemicals directly into waterways and/or in the near proximity of homes or workplaces)
- Positive projects that help mitigate or undo environmental damage done (e.g., carbon sinks, wetland restoration, land conservation, donation to alternative energy research, etc)
- Invention of new technologies that lead to greater environmental sustainability beyond the company’s direct reach
Community
- Injuries, sickness, or other direct harm done to consumers by the company’s products or services
- Development of new vaccines, drugs, and other treatments for diseases of poverty
In general, as well, these additional factors include any company’s attempt to subvert the government’s collection of data to construct these Corporate Responsibility Rankings
Why We Need It
: Within a system like CR Rankings, it is inevitable that some ways a company can be responsible or irresponsible will not fit neatly into one of the other metrics. The Additional Factors metric allows for all such extra actions to still be factored into company’s rankings.In other words, this metric handles all corporate behavior that isn’t quantifiable and/or universal. As mentioned above, to work as one of the main metrics for CR rankings, a measure of irresponsibility must be both quantifiable and universal. That is, such a metric must be measurable with objective data and must apply to most if not all companies.
For instance, pretty much every business pollutes, pays taxes, uses water, etc. Furthermore, such actions are measurable with objective data. Each company generates a specific number of tons of each pollutant. Each company pays a certain number of dollars in taxes. Each company uses a certain number of gallons of water. A company could always try to illegally fudge the facts a bit with such metrics and might even get away with it every once in a while, sure, but ultimately what matters most is that we can actually get objective, rather accurate measurements that apply to pretty much all companies.
However, there will inevitably be other important factors of responsibility that that don’t quite fit those two basic requirements of being both quantifiable and universal. For example, consider an oil spill like the Exxon Valdez catastrophe of ’89 or the more recent Deepwater Horizon oil rig explosion in the Gulf of Mexico. Such oil spills caused massive environmental damage to the ecosystems involved, and the perpetrating companies should rightly deserve to have their rankings docked in such situations (had CR Rankings existed at the time). The problem, though, is that any attempt to quantify the damage done would be, at best, awkward and inevitably rather inaccurate. The simplest task of all, assessing the number of gallons of oil spilt into the gulf in the more recent spill, proved hardly simple at all. At the time, British Petroleum estimated 1,000-5,000 barrels of oil were gushing out a day.13 The Flow Rate Technical Group, on the other hand, estimated a quite different 62,000 barrels a day.14
In addition to not being easily quantifiable, oil spills also fail the other main requirement of a standalone metric: being universal. How many other companies have been involved in oil spills? Almost none. This is an important distinction because CR Rankings work by being relative. Each company is compared to all others with each factor of corporate responsibility. How much carbon dioxide does it create compare to all other companies. How well does it pay its workers compared to all other companies. You cannot rank companies relatively, though, with a factor that only applies to a random few companies and no others. It would make little sense, in other words, to create an Oil Spill metric where 99.9% of companies get perfect 10’s, with Exxon-Valdez and BP put down in timeout at the bottom with 0’s. What good would that do? The same goes for many other instances of corporate irresponsibility that are clearly bad but are hardly universal and, therefore, very hard to include in data-driven comparisons: mountaintop removal, child labor, human trafficking, wetland destruction, etc. As such, the Additional Factors metric will add or subtract points from any company’s rankings for all such factors beyond the scope of CRR’s other metrics.
One key way companies could boost their CR Rankings with the AF metric would be innovation points. Any company that makes discoveries that would help the world at large (beyond the good derived from its own direct actions) would be rewarded with innovation points. Those points would then translate to higher CR Rankings. New green energy technologies and new treatments for diseases of poverty, for example, would garner high innovation points. Note that this isn’t the same as just buying new, more energy-efficient truck engines and using them in your shipping fleet. If you design that more energy-efficient engine, though, then your design will go to carbon reductions among shipping companies that use your new type of engine all around the world, and thus your company would earn innovation points. For more on innovation points, see the Additional Notes section below.
For more on what the Additional Factors metric can accomplish overall, check out Problems CRR Would Help Fix in the Why CRR page. More specifically check out the sections on Global Warming, Rainforest Destruction, Diseases of Poverty, Gender Pay Gap, Racial Pay Gap, Antibiotic Resistance, Child Labor, Wetland Destruction, Mountaintop Removal, and Species Endangerment and Extinction
Endnotes
1 “Minimum Wages in Bangladesh with Effect from 01-12-2013.” Current Minimum Wage Rates in Bangladesh, Wageindicator.org, 15 Mar. 2016, www.wageindicator.org/main/salary/minimum-wage/bangladesh.
2 Exchange Rate, exchangerate.guru/bdt/usd/1500/. Accessed 5 Sept. 2017.
3 “Water Uses.” AQUASTAT - FAO's Information System on Water and Agriculture, Food and Agriculture Organization of the United Nations, 2016, www.fao.org/nr/water/aquastat/water_use/index.stm.
4 Wenzlau, Sophie. To Combat Scarcity, Increase Water-Use Efficiency in Agriculture. Worldwatch Institute, 1 Mar. 2013, www.worldwatch.org/combat-scarcity-increase-water-use-efficiency-agriculture-0.
5 Running Dry. The Economist, 18 Sept. 2008, www.economist.com/node/12260907.
6 Gravelle, Jane G. “Tax Havens: International Tax Avoidance and Evasion.” Congressional Research Service, 15 Jan. 2015, www.fas.org/sgp/crs/misc/R40623.pdf.
7 Charitable Giving Statistics. National Philanthropic Trust, www.nptrust.org/philanthropic-resources/charitable-giving-statistics/. Accessed 8 Oct.
8 Posey, Kirby G. “Household Income: 2015.” Sept. 2016, p. 2, www.census.gov/content/dam/Census/library/publications/2016/demo/acsbr15-02.pdf.
9 $2,974, the average household contribution to charity, is 5.7% of $55,775, the median US household income in 2015.8
10 “Giving Statistics.” Charity Navigator, www.charitynavigator.org/index.cfm/bay/content.view/cpid/42. Accessed 6 Dec. 2016.
11 Sparshott, Jeffrey, and Eric Morath. “Corporate Profits in 2015 – The Numbers.” The Wall Street Journal, Dow Jones & Company, 25 Mar. 2016, blogs.wsj.com/briefly/2016/03/25/corporate-profits-in-2015-the-numbers/.
12 Dividing the total US corporate donations in 2015 of $18.45 billion10 by the total corporate (pre-tax) profits 2015 of $1.89 trillion11 (and then multiplying by 100) yields 0.98% given to charity.
13 Webb, Tim. Scale of BP Oil Leak Revised up to 40,000 Barrels a Day. The Guardian, 11 June 2010, www.theguardian.com/environment/2010/jun/12/bp-oil-spill-gulf-mexico.
14 McNutt, Marcia K., et al. “Review of Flow Rate Estimates of the Deepwater Horizon Oil Spill.”Proceedings of the National Academy of Sciences of the United States of America, National Academy of Sciences, 11 Dec. 2012, www.ncbi.nlm.nih.gov/pmc/articles/PMC3528583/.